Download
1 / 26
260 likes | 427 Views
Strong Lensing by Clusters of Galaxies. Joseph F. Hennawi UC Berkeley. Fermilab June 14, 2007. Outline. Cosmology with Cluster Lenses Giant Arc Abundance Suggestive Anomalies SDSS Giant Arc Survey. Suspects. Paul Bode (Princeton). Neal Dalal (IAS). Jeremiah Ostriker (Princeton).

E N D
Strong Lensing by Clusters of Galaxies Joseph F. Hennawi UC Berkeley Fermilab June 14, 2007
Outline • Cosmology with Cluster Lenses • Giant Arc Abundance • Suggestive Anomalies • SDSS Giant Arc Survey
Suspects Paul Bode (Princeton) Neal Dalal (IAS) Jeremiah Ostriker (Princeton) Ben Koester (Chicago) Priya Natarajan (Yale) Håkon Dahle (University of Oslo ) Masamune Oguri (Princeton) Mike Gladders (Chicago)
Cosmology with Cluster Lenses • Why is Strong Lensing by Clusters Interesting? • Natural Gravitational Telescopes magnify high-z galaxies • Measure Cosmological Parameters?? • Study the small scale distribution of dark matter in clusters. • Galaxies don’t get much bigger than 1013 M. So interior to the Einstein radii of the widest arcs, the M/L ratio is > 10: ;
N(>r) Number of Arcs r [arcsecs] 6,000,000 Question: Can we neglect dissipative physics? YES: For large angle arcs, observables predictable ab initio NO: Must simulate effects of dissipation on DM distribution. Can we Neglect the Baryons? • For giant arcs with > 20”, the mass enclosed by the Einstein radius is dominated by dark matter. • Effect of Cooling and BCG formation on DM: • DM adiabatically contracts and density profile steepens (increase lensing) • DM halo becomes more circular (decrease lensing) • Recent work claims factor of ~ 2 increase (Rozo et al. 2006, Puchwein et al. 2006), but sims suffer from severe overcooling.
Cluster Lensing Statistics Giant Arc Abundance(talks by Horesh, Gilbank and Scarpine’s poster) • Count number of arcs per deg2. Compare to N-body sims. Absolute counts vulnerable to many systematics (next slide). • Need deep ground based images of clusters over > 1000 deg2 (there is about 1 arc per 40 deg2). • Measure relative distribution of lens mass, redshift, or arc angular separation. Much less vulnerable to systematics. Detailed Modeling(see talks by Sharon & Kneib) • Measure lens parameters (concentration, ellipticity, inner profile slope, subhalos). Compare to distributions from simulations. • Requires spaced based imaging. Thus far only handfuls studied. • Strongest constraints when combined with wide field WL. • Dramatic lenses represent atypical clusters. Must quantify this.
Giant Arc Abundance Theoretical Uncertainties • Source counts: Need to use real HST images as background source planes (factor ~ 2-3).(See talk by Horesh). • Ray tracing simulations disagree (factor ~ 2 ). • Have simulations converged for rarest objects? Largest sims correspond to area < 100 deg2, for 0 < z < 1 (factor ~ ??). • Baryons/Dissipation effect on DM? (factor ~ 2). • Cosmological parameters (m, 8): WMAP3 (0.24, 0.74) differs from concordance (0.3, 0.9) by factor ~ 6. Observational Uncertainties • Arc detection/Selection Function :“arcs by eye” breaks down near surface brightness limit (factor ~ ??). (See talks by McGinnis, Seidel, Horesh and poster by Scarpine). • Uncertainties in mass limit for snapshot surveys (factor ~ ??).
Ray Tracing Simulations • Identify massive cluster halos in cosmological N-body simulation Massive Cluster Lens Plane • Compute surface density. Solve lens equation for mapping from source plane to image plane • Place background sources at random positions in source plane Source Plane Image Plane • Map each source pixel to image plane and identify giant arcs
Lens Redshift Distribution • Sims predict ~ 5 z < 0.6 arcs in RCS-1. None found. • Prediction made with params: (m, , 8) = (0.3, 0.7, 0.95). Lower 8, would make high-z clusters much less common?? RCS-1 Are high redshift lenses over-represented? Simulated Hennawi, Dalal, Bode, Ostriker (2007) Comparison of RCS-1 to Simulation Predictions
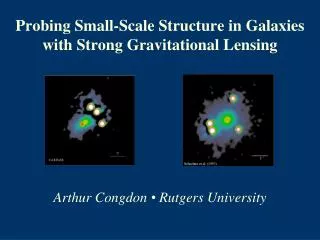
Predicted Concentration Distribution All Clusters dP/dcNFW Lensing Clusters 3 best studied lenses cNFW = 13.7! cNFW Hennawi, Dalal, Bode, Ostriker (2007) Anomalous Concentrations? Abell 1689: ~ 100 images of ~ 30 lensed sources Broadhurst et al. (2005) • Two other high concentration clusters using same technique: • CL0024+1654, cNFW = 26.2! (Kneib et al. 2003) • MS2137-2353 cNFW =14.6 (Gavazzi et al. 2003). • But see Limousin et al. (2007) who found cNFW = 9.5 for Abell 1689. • Less than 2% of lenses should have concentrations this high. Why are the 3 best studied systems in the tail of the distribution?
SDSS Giant Arc Survey SDSS Cluster Catalog • ~ 10,000 clusters from RCS technique (Gladders et al. 2007) • Largest cluster catalog ever created. • Photo-z’s accurate to dz ~ 0.02 • 8000 deg2 over 0.1 < z < 0.6, ~ 2 (Gpc/h)3 SDSS Sized Hammer • But SDSS imaging is too shallow (g< 22 mag/) and seeing is too poor (FWHM ~ 1.4) to find substantial #’s of arcs. • Solution: Snapshot imaging survey of ~ 300 most massive clusters using 2-4m telescopes with good image quality. • Low redshift complement to high-z surveys such as RCS. • Probe ~ 40 times larger volume than any previous arc survey.
Survey Telescopes UH 2.2m NOT 2.5m telescope • g < 25.7 in 10 mins • median seeing = 0.65” WIYN 3.5m Telescope • g < 25.7 in 10 mins • median seeing = 0.7” UH 88-inch telescope • V < 26.9 in 30 mins • median seeing = 0.6”
New Cluster Lenses Shallow SDSS gri composite Deep WIYN gri composite 30” Cluster photo - z = 0.50 Hennawi et al. (2006)
New Cluster Lenses Shallow SDSS gri composite Deep WIYN gri composite Counter Image? 30” Cluster z = 0.65 ; Arc z = 1.14 (spectra from Magellan) Hennawi et al. (2006)
New Cluster Lenses Hennawi, et al. (2006)
Survey Status • Nearly 300 clusters imaged thus far, of which ~ 160 have sub-arcsecond image quality. • About 30 new cluster lenses discovered, including several dramatic “poster child” systems. • Several high surface brightness cB58-ish arc candidates. • Survey about half complete. 17 nights scheduled next semester. • The bright arcs we discover are ideally suited for spectroscopic follow-up. • Arc spectroscopy from Magellan and (hopefully) Gemini. • Weak lensing underway at Subaru 8m and NOT 2.5m.
Conclusions/Future Work • Cluster lensing is a powerful probe of the dark matter distribution on ~ 100 kpc/h scales. • Currently, comparison of giant arc abundance to theory is probably only believable to factor ~ 10. • Large statistical samples of lenses required to address suggestive differences between observations and CDM. • Future Work: • Study effects of baryons on DM. • Improve accuracy of ray tracing simulations. • End to end simulation pipelines that look like the data. • Automate arc detection and quantify selection functions. • Detailed mass modeling of new lenses discovered. Will require follow-up with HST, WL, and spectroscopy.
Biases in Lensing Selected Samples With a sample of well studied lensing clusters we can measure distributions of cluster properties. However lenses are biased with respect to . . . . Concentration Mass [c/c(M)]1/2 = 1.18 M1/2 = 4.5 1014 Mvir c/c(M) Substructure Orientation [Msub]1/2 = 0.045 [Msub]1/2 = 0.041 q2 lower third q2 middle third q2 upper third |cos|1/2 = 0.50 |cos|1/2 = 0.67 Msub |cos|
Solid: EMSS Dashed: Simulations N(>r) Number of Arcs r [arcsecs] Comparison of Arc Surveys to Ray Trace Predictions Dalal, Holder, & Hennawi (2004) Giant Arc Abundance • EMSS: 8 of 38 clusters with LX > 2 1044 ergs/s show giant arcs. • Extrapolating gives ~ 900 over full sky. • Ray tracing sims + HDF galaxy counts predicts ~ 1000 • NO GIANT ARC PROBLEM! • Previous claim of order of magnitude discrepancy incorrectly extrapolated EMSS and used lower source density
Quasars Multiply Imaged by Clusters • Predict ~ 2 lenses with > 10” in current (~ 4000 deg2) sample • Consistent with discovery of quad lens SDSS 1004 SDSS Spectroscopic Quasars SDSS Photometric Quasars • Predict ~ 8 lenses with > 10” in current (~ 7000 deg2) sample • ~ 1 should have > 30” • ~ 1 will have zs ~ 4 Hennawi et al. (2005) in prep
Analog Halos Simulated Spherical No Substructure Triaxial
Analog Halos Source plane: zs = 2.0; Lens Plane: zd = 0.41 • Replace each halo with analog halo. Ray trace and compare number of arcs to original simulated clusters • Substructure identified by FOF algorithm with b= 0.05 • Triaxiality boosts cross sections by factor 4-25 compared to spherical • Analytical models under predict arc abundance by • up to 50 for spherical models • up to 2 for triaxial models • Halo Triaxiality much more important than projections of substructure onto small radii N(>) Number of Arcs Hennawi et al. (2005) in prep
Cluster Lenses in the SDSS Multiply Imaged Quasars Giant Arcs ARC 3.5m WIYN 3.5m SDSS 2.5m UH 2.2m • SDSS quasar samples • Spectro: 50,000 quasars -- 4000 deg2 • Photo: 400,000 quasars -- 7000 deg2 • Search for companions around quasars with similar colors • Follow up spectroscopy (ARC 3.5m) required because of fiber collisions Jim Gunn Apache Point Observatory • SDSS cluster sample • Richness selected clusters out to z < 0.6 -- 7000 deg2 or ~ Gpc3 • Photo-z’s good to within dz = 0.02 • Deep imaging (g < 26) of richest clusters on 4m class imagers • Arc redshifts from Magellan and MMT • HST imaging of lenses discovered?
Counter Image? SDSS Arcs • Brightest arc (g ~ 22 ) = 11” • Discovered by visual inspection of SDSS southern coadd data (r < 24) • Magellan spectroscopy • BCG galaxy @ z = 0.65 • Arc A @ z = 1.14 • Preliminary models prefer the BCG to be off center? 30” Extreme example of minor axis cusp? Or instead, is BCG off-center? WIYN gri composite - seeing ~ 0.6” Lin et al. (2005) in preparation
SDSS Arcs A 30” B WIYN g + i composite - seeing ~ 1.2” • Arcs at = 35” and = 12” • Abell cluster @ z = 0.28. LX = 8.7 1044 (NORAS) • Models prefer high ellipticities (q < 0.5) for inner slopes typical of CDM halos (n ~ 0.5) Hennawi et al. (2005) in preparation
z=1.734 B A G1 D C The Widest Lensed Quasar Largest Splitting = 14.6”! Fifth Image? ACS Original ACS Subtracted Inada et al. (2003) Oguri et al. (2004) Inada et al. (2005) HST ACS HST NICMOS