Download
1 / 33
330 likes | 450 Views
pettit. Department of the Environment, Heritage and Local Government . National Urban Waste Water Study. National Urban Waste Water Study (Covers catchments with a population equivalent of 2,000 or more outside the Greater Dublin Area). Objectives & Deliverables. Study Objectives.

E N D
pettit Department of the Environment, Heritage and Local Government National Urban Waste Water Study National Urban Waste Water Study (Covers catchments with a population equivalent of 2,000 or more outside the Greater Dublin Area)
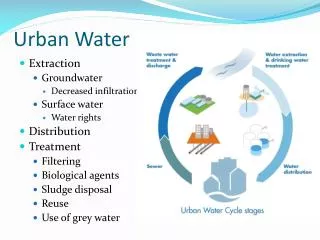
Study Objectives • Capture and analyse all readily available data • Assess scheme capacities & future shortfalls / excesses • Identify future network investigation needs and costs • Assess management and maintenance practices • Make recommendations for targeting investment & monitoring performance
Specific Deliverables • National Report plus Executive Summary • County Reports (26) including 170 individual Catchment Reports • Assessment Methodologies • Development Guidelines • Database and Geographic Information System • Cost estimates for future network survey & analysis
Team Structure Joint Venture Peer Review Group Steering Committee Babtie Project Management Region 1 E G Pettit Region 2 J B Barry Region 3 White Young Green
Pettit & Company Barry & Partners White Young Green Regional Management
Programme of Work • Nov 01- Apr 02: Pilot study to test questionnaire approach • May 02 – Oct 02: Questionnaire survey • Nov 02 – Apr 03: Draft the catchment reports • May 03– Nov 03: Validate & finalise catchment reports • Dec 03 – Apr 04: Draft the county & national reports
Data Management • Data collection questionnaires issued to each county • Data collection team visited county staff & treatment plant • Questionnaires populated 200,000 cell database • Analysis presented in 170 catchment reports • County/catchment reports: 20,000 key output numbers • National report: 200 key output numbers
Audit & Verification Process • Questionnaires reviewed by JV with LA staff at the time the data was compiled • Key values checked against industry average values or standard estimates • JV quality management procedures applied • Reports reviewed by LA staff and/or DEHLG • Comments considered by JV teams - reports amended as necessary & finalised
Key Success Factors • High level of commitment to NUWWS by LA staff • LA operator knowledge of unrecorded assets • Web sites for environmental & population data • Detailed verification by LAs & DEHLG
Executive Summary 1 Introduction 2 Methodology 3 Findings (7 items) 4 Recommendations (10 items) (10 page document complete with CD Rom of whole report)
National Report 1 Introduction 2 Method of Approach 3 The Catchments 4 Environmental Factors 5 Sewerage System 6 Waste Water Treatment 7 Sludge Disposal 8 Database & GIS 9 Guidelines 10 Cost Estimates
Appendices A Method of Approach Questionnaires, Network statistics Flow & load assessment Receiving waters & treatment plant capacity Network survey requirements B Database & GIS User manual – a guide to accessing & updating information C Development Guidelines Asset inventory & valuation Investment prioritisation Network rehabilitation practices D Cost Estimates
County Reports 1 Introduction 2 Methodology 3 Catchment Report Summaries Appendices The Brief Catchment Reports 1 The Catchment 2 Environment Factors 3 Sewerage System 4 Waste Water Treatment 5 Sludge Treatment
Catchment Reports 1 The Catchments Areas, planning targets & population projections 2 Environmental Factors Receiving water characteristics, flows & loads 3 Sewerage System Asset inventory & network integrity audit Operational management Surveys & investigations, performance & capacity 4 Waste Water Treatment Process & inventory, condition performance & capacity Operational management, Upgrading requirements 5 Sludge Disposal
Data Deficiencies (Assessed from data collection exercise)
Wastewater Flow and Load • Flow & load assessed for the following sectors: - Domestic - Industrial - Commercial - Institutional - Tourism • Domestic population figures frequently open to question • Non-domestic flow & load data frequently incomplete
Sewerage System • Up to date network plans frequently not available • Combined sewer overflow records suggest there may be many unlisted overflows • Little reliable data on overall structural condition • Almost no information on frequency of storm events causing flooding
Treatment Plant • Monitoring of effluent load frequently did not conform to statutory requirements • Flow & load records frequently of limited value as they did not identify dry weather flow periods • Water quality & stream flow data not available for all sites
Finding One Sewerage Network Assets • Little detailed knowledge for some 40% of networks • 40% of networks have no recorded overflows ! • Indicative network quantities : - 5,900km of Sewers & Rising Mains - 480 Combined Sewer Overflows - 640 Pump Stations
Finding Two Performance of Network • 89% of networks reported one or more failures as below • Frequency of failures not commonly known ! - 17% of catchments reported property flooding - 72% of catchments reported flooding of environs - 42% of catchments reported structural failures - 56% of catchments reported watercourse pollution
Finding Three Receiving Waters • Assimilative capacity of 111 receiving water assessed • 86% of receiving waters found to have restricted capacity - 76% due to Phosphate levels - 29% due to BOD levels
Recommendation One Understand Sewer Network • Update the network records & plans • Confirm condition of networks & ancillaries • Monitor/record network performance/incidents
Recommendation Two Receiving Waters – Quality Monitoring • Upgrade sampling of treatment plant effluents • Locate all combined sewer overflows • Install monitoring devices on key overflows
Summary Key Issues: • Compile & maintain accurate asset records • Understand the condition of the core assets • Compile & maintain reliable performance data
pettit Department of the Environment, Heritage and Local Government National Urban Waste Water Study End of storey so far…… Thank you all Ian Aikman Project Manager
Footnote As of 12 August, Babtie Group became part of the Jacobs group of companies and is now known as Jacobs Babtie