Download
1 / 27
270 likes | 418 Views
The Role of Metabolic Dysfunction in Heart Failure 2013 Cardiac Physiome Workshop, Bar Harbor, ME October 17 , 2013 Scott M. Bugenhagen MD/PhD student Department of Physiology Medical College of Wisconsin. What is heart failure?.

E N D
The Role of Metabolic Dysfunction in Heart Failure 2013 Cardiac Physiome Workshop, Bar Harbor, MEOctober 17, 2013 Scott M. Bugenhagen MD/PhD student Department of Physiology Medical College of Wisconsin
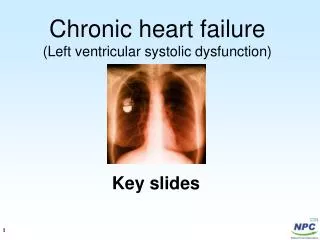
What is heart failure? “heart failure: inability of the heart to maintain cardiac output sufficient to meet the body's needs” -Dorland’s Medical Dictionary, 2007 Dx involves various algorithms (Framingham, European Society of Cardiology, others) based on criteria from medical history, physical examination, laboratory tests, response to therapy, etc. image from wikipedia.org
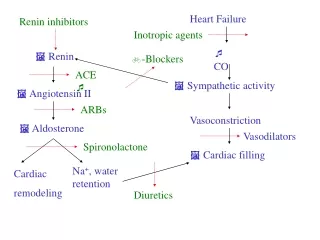
___ __ ___ ____ __ _________ _______ __ _____ _______ What causes heart failure? Adapted from Beard, Examination of the “Dominant Role of the Kidneys in Long-Term Regulation of Arterial Pressure and in Hypertension”, Physiology Seminar 2013
What causes heart failure? ??? Adapted from McKinsey, T.A. and Olson, E.N. (2005) J Clin Invest 115, 538-46.
A Primer on Cardiac Energy Metabolism Physiological control: In vitro (purified mitochondria) and in vivo data are consistent with the hypothesis that cardiac energy metabolism is primarily regulated through feedback of substrates for oxidative phosphorylation. In heart failure: Changes in metabolite pools lead to diminished ATP hydrolysis potential. Wu et al. (2009) PNAS USA 106:7143-7148. EDP < 15 mmHg EDP > 15 mmHg
A Primer on Cardiac Energy Metabolism Ca2+ Ca2+ Ca2+ Na+ OH- H+ K+ ATP ATP ATP Na+ Cl- K+ Na+ Na+ K+ Ca2+ Na+ Ca2+ Glycolysis Pyr Glc FACS FFA FACoA Na+ Ca2+ Na+ Ca2+ HCO3- HCO3- ATP + ADP Pi Cl- Myofilaments Ca2+ NADH Mitochondria MAS Subspace Sacroplasmic reticulum NAD NXB Ca2+ MgATP PXB AM1 MgADP Pi AM2 XBPreR Cytoplasm Ca2+ FATP GLUT
Can energy failure cause heart failure? Goal: To develop a mathematical model linking cardiac energy metabolism with cell- and organ-level cardiac mechanics and whole-body cardiovascular dynamics in order to test the hypothesis that energy failure alone provides a sufficient explanation for the mechanical changes observed in heart failure.
___ __ ___ ____ __ _________ _______ __ _____ _______ The Grand Vision image from wikipedia.org
Cardiovascular hemodynamics from Lumens J, Arts T, et al. Ann Biomed Eng. 2009 Nov;37(11):2234-55 from Smith BW, JG Chase , et al. Medical Engineering & Physics. 2004 Mar;26(2):131-39
___ __ ___ ____ __ _________ _______ __ _____ _______ The Grand Vision image from wikipedia.org
___ __ ___ ____ __ _________ _______ __ _____ _______ Cardiac energy metabolism From Wu et al. (2007) JBC 282:24525-24537
___ __ ___ ____ __ _________ _______ __ _____ _______ Cardiac energy metabolism 12 12 0.12 10 10 0.10 8 8 0.08 6 6 0.06 4 4 0.04 2 2 0.02 0 0 0 2 4 6 8 10 0 12 2 4 6 8 10 2 4 6 8 10 0 12 0 12
___ __ ___ ____ __ _________ _______ __ _____ _______ Cardiac cell mechanics Ca2+ Ca2+ Ca2+ OH- Na+ H+ K+ ATP ATP ATP Na+ K+ Na+ Cl- Na+ K+ Ca2+ Na+ Ca2+ Glycolysis Pyr Glc FACS FFA FACoA Na+ Ca2+ Na+ Ca2+ HCO3- HCO3- ATP + ADP Pi Cl- Myofilaments NXB MgATP PXB AM1 MgADP Pi AM2 XBPreR GLUT FATP • Components • Electrophysiology • Calcium handling • Signaling (CaMKII, β-AR, others) • Cross-bridge Sympathetic nerve Norepinephrine Ca2+ NADH Mitochondria MAS Diad space Sacroplasmic reticulum NAD Ca2+ CaMKII Cytoplasm Ca2+
___ __ ___ ____ __ _________ _______ __ _____ _______ Cardiac cell mechanics Ca2+ Ca2+ Ca2+ ATP ATP Na+ Ca2+ Ca2+ Ca2+ Myofilaments • Components • Electrophysiology • Calcium handling • Signaling (CaMKII, β-AR, others) • Cross-bridge Sympathetic nerve Norepinephrine fast buffer slow buffer Ca2+ Diad space Sacroplasmic reticulum Ca2+ CaMKII Cytoplasm Ca2+
___ __ ___ ____ __ _________ _______ __ _____ _______ Cardiac cell mechanics
___ __ ___ ____ __ _________ _______ __ _____ _______ Electrophysiology control w/ 30nM isoprenaline
___ __ ___ ____ __ _________ _______ __ _____ _______ Calcium handling
___ __ ___ ____ __ _________ _______ __ _____ _______ Cross-bridge
___ __ ___ ____ __ _________ _______ __ _____ _______ Cross-bridge
___ __ ___ ____ __ _________ _______ __ _____ _______ Integrated HF model version 1.0 – Lumens/Smith/Wu/Tran Healthy resting conditions: MVO2 ≈ 3.5 μmol O2 min-1 (g tissue)-1 [MgATP] ≈ 8 mM [MgADP] ≈ 0.08 mM [Pi] ≈ 0.2 mM HF resting conditions: MVO2 ≈ 3.5 μmol O2 min-1 (g tissue)-1 [MgATP] ≈ 1.5 mM [MgADP] ≈ 0.01 mM [Pi] ≈ 0.8 mM
___ __ ___ ____ __ _________ _______ __ _____ _______ Integrated HF model version 1.0 – Lumens/Smith/Wu/Tran Healthy resting conditions: MVO2 ≈ 3.5 μmol O2 min-1 (g tissue)-1 [MgATP] ≈ 8 mM [MgADP] ≈ 0.08 mM [Pi] ≈ 0.2 mM HF resting conditions: w/ Volume adjusted to 0.61 x control MVO2 ≈ 3.5 μmol O2 min-1 (g tissue)-1 [MgATP] ≈ 1.5 mM [MgADP] ≈ 0.01 mM [Pi] ≈ 0.8 mM
___ __ ___ ____ __ _________ _______ __ _____ _______ Integrated HF model version 1.0 – Lumens/Smith/Wu/Tran Healthy exercise conditions: w/ Resistance adjusted to 0.33 x control MVO2 ≈ 10.5 μmol O2 min-1 (g tissue)-1 [MgATP] ≈ 8 mM [MgADP] ≈ 0.1 mM [Pi] ≈ 2.5 mM HF exercise conditions: w/ Resistance adjusted to 0.25 x control w/ Volume adjusted to 0.61 x control MVO2 ≈ 10.5 μmol O2 min-1 (g tissue)-1 [MgATP] ≈ 1.5 mM [MgADP] ≈ 0.04 mM [Pi] ≈ 10 mM
___ __ ___ ____ __ _________ _______ __ _____ _______ Acknowledgements Dissertation Committee Daniel Beard (Advisor) Brian Carlson Paul Goldspink Andrew Greene Michael Widlansky Jeff Saucerman Funding VPR - National Institute of Health Grant No. P50-GM094503 Programs Department of Physiology Graduate Program Medical Scientist Training Program