Download
1 / 63
640 likes | 785 Views
MuCap Collaboration V.A. Andreev, T.I. Banks, B. Besymjannykh, L. Bonnet, R.M. Carey, T.A. Case, D. Chitwood, S.M. Clayton, K.M. Crowe, P. Debevec, J. Deutsch, P.U. Dick, A. Dijksman, J. Egger, D. Fahrni, O. Fedorchenko,

E N D
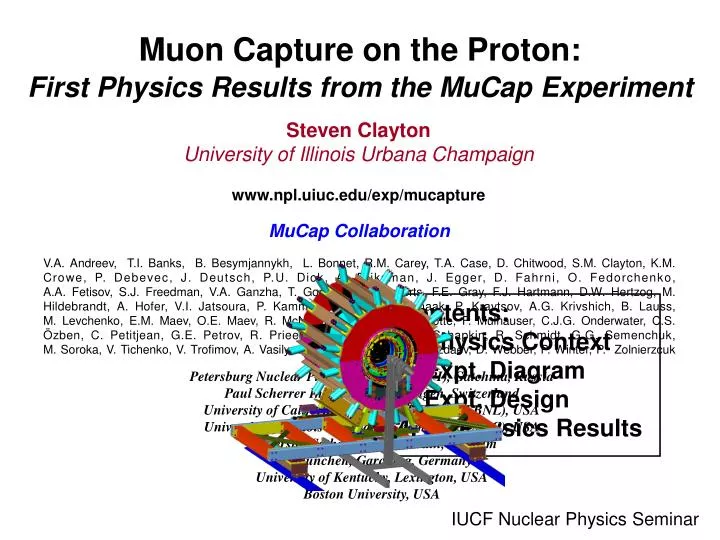
MuCap Collaboration V.A. Andreev, T.I. Banks, B. Besymjannykh, L. Bonnet, R.M. Carey, T.A. Case, D. Chitwood, S.M. Clayton, K.M. Crowe, P. Debevec, J. Deutsch, P.U. Dick, A. Dijksman, J. Egger, D. Fahrni, O. Fedorchenko, A.A. Fetisov, S.J. Freedman, V.A. Ganzha, T. Gorringe, J. Govaerts, F.E. Gray, F.J. Hartmann, D.W. Hertzog, M. Hildebrandt, A. Hofer, V.I. Jatsoura, P. Kammel, B. Kiburg, S. Knaak, P. Kravtsov, A.G. Krivshich, B. Lauss, M. Levchenko, E.M. Maev, O.E. Maev, R. McNabb, L. Meier, D. Michotte, F. Mulhauser, C.J.G. Onderwater, C.S. Özben, C. Petitjean, G.E. Petrov, R. Prieels, S. Sadetsky, G.N. Schapkin, R. Schmidt, G.G. Semenchuk, M. Soroka, V. Tichenko, V. Trofimov, A. Vasilyev, A.A. Vorobyov, M. Vznuzdaev, D. Webber, P. Winter, P. Zolnierzcuk Petersburg Nuclear Physics Institute (PNPI), Gatchina, RussiaPaul Scherrer Institute (PSI), Villigen, Switzerland University of California, Berkeley (UCB and LBNL), USAUniversity of Illinois at Urbana-Champaign (UIUC), USAUniversité Catholique de Louvain, BelgiumTU München, Garching, GermanyUniversity of Kentucky, Lexington, USABoston University, USA Muon Capture on the Proton: Steven Clayton University of Illinois Urbana Champaign www.npl.uiuc.edu/exp/mucapture First Physics Results from the MuCap Experiment • Contents: • Physics Context • Expt. Diagram • Expt. Design • 1st Physics Results IUCF Nuclear Physics Seminar
m- Stopping in Hydrogen m- • Quickly forms a mp atom, transitions to ground state, transitions to singlet hyperfine state. Bohr radius a ≈ a0 me/mm≈ a0/200 • Most of the time, the m decays: • Occasionally, it nuclear captures on the proton: p H2 - m+ e- + nerate l0 = 1/tm+ BR≈0.999 - + p m+ n rate LSBR~10-3 - + p m+ n + g BR~10-8, E>60 MeV The goal of mCap is Ls to 1% precision Complications: molecular formation/transitions, transfer to impurity atoms, …
u gm(1-g5) d W m n Nuclear Physics Context EW current key probe for nucleon structure Understanding hadrons from fundamental QCD • lattice QCD • chiral effective field theory (ChPT) p Goldstone boson of spontaneously broken symmetry, sys. expansion in q/L model independent predictions fundamental properties and symmetry tests interesting processes (astrophysics) interface to lattice calculations… nucleon level quark level q q relevant degrees of freedom ? W m n
Muon Capture and Axial NucleonStructure • - + p m+ n • rate LS + second class currentssuppressed by isospin symm. Lorentz, T invariance Conserved Vector Current CVC Vector form factorsq2= -0.88 mm2 gV = 0.9755(5) gM = 3.5821(25) strong program JLab, Mainz, ... Axial form factorsq2= -0.88 mm2 gA = 1.245(3) gP = 8.3 ± 50% Main motivation formCap studies
Axialvector Form Factor gA Lattice QCD Axial radius Exp. History n+N scattering consistent with p electroproduction (with ChPT correction) Bernard et al. (2002) Edwards et al. LHPC Coll (2006) PDG 2006 introduces 0.4% uncertainty to LS (theory)
gpNN n p p Fp m- nm Pseudoscalar Form Factor gP gP determined by chiral symmetry of QCD: gP= (8.74 0.23) – (0.48 0.02) = 8.26 0.23 PCAC pole term Adler, Dothan, Wolfenstein ChPT leading order one loop two-loop <1%N. Kaiser Phys. Rev. C67 (2003) 027002 • gP basic and experimentally least known weak nucleon form factor • solid QCD prediction via ChPT (2-3% level) • basic test of QCD symmetries Recent reviews:T. Gorringe, H. Fearing, Rev. Mod. Physics 76 (2004) 31V. Bernard et al., Nucl. Part. Phys. 28 (2002), R1
Processes to Determine gP • - + p m+ n OMC rate LSBR~10-3 • 8 experiments, typical precision 10-15%, Saclay 4% • - + p m+ n + g RMCBR~10-8, E>60 MeV • - + 3He m+ 3H • pion electroproduction 279±25 eventsBRg(k>60MeV)=(2.10±0.21)x10-8 Wright et al. (1998) … rad. corrections?
f = 1 (Liquid) f = 0.01 (~10 bar gas) Rel. Population Rel. Population Time after mp Formation Time after mp Formation Muon Atomic/Molecular State in Experiment must be known to connect with theory. Ls ~ 664 s-1 Lom≈ ¾ Ls Lpm≈ ¼ Ls mp(F=0) pmp(J=1) Ortho pmp(J=0) Para lppf lOP H2 density
Precise Theory vs. Controversial Experiments gP - + p m+ n @ Saclay - + p m+ n + g@TRIUMF ChPT mCapprecisiongoal TRIUMF 2005 exp theory lOP(ms-1) • no overlap theory & OMC & RMC • large uncertainty in lOP gP 50% ?
LT Ls Lom Lpm lppf lOP m- pmp(J=1) Ortho pmp(J=0) Para lpZcZ mp(F=0) lpdcd LZ ~ Z4 mp(F=1) n + nm + (Z-1)* mZ md Ld Relevant Kinetics in 10 bar H2 H2 must be pure isotopically and chemically: cd < 1 ppm, cZ < 10 ppb
mCap Experimental Strategy • Unambiguous interpretation • capture mostly from F=0 mp state at 1% LH2 density • Lifetime method • 1010m-→enn decays • measure - to 10ppm, • S = 1/- - 1/+to 1% • Clean m stop definition in active target (TPC) • to avoid:mZ capture, 10 ppm level • Ultra-pure gas system and purity monitoring • to avoid: mp + Z mZ+ p, ~10 ppb impurities • Isotopically pure “protium” • to avoid: mp + d md+ p, ~1 ppm deuterium • diffusion range ~cm fulfill all requirements simultaneouslyunique mCap capabilities
slope = l ≡ 1/t Log Nevents DT Lifetime Method mCap measures the lifetime of m- in 10 bar hydrogen gas. e- Data Acquisition Telectron m- H2 Tzero DT Repeat 1010 times for a 10 ppm precision lifetime measurement. Ls = l – 1/tm+
mCap Detailed Diagram • Tracking of Muon to Stop Position in Ultrapure H2 Gas • Tracking of Decay Electron
Commissioning and First Physics Data in 2004 (Target Pressure Vessel, Pulled Back)
Time Spectra Impact Parameter Cut m- m-e impact parameter cut huge background suppression diffusion (deuterium) monitoring Nle-lt + B m+as reference identical detector systematics different physics m+ mSRin 50G blinded master clock frequency
Side View m Stop m Beam y (Drift Time) x (Strip Number) z (Anode Number) Clean m Stop Definition in Active Target Time Projection Chamber (TPC) 10 bar ultra-pure hydrogen, 1% LH2 2.0 kV/cm drift field ~5.4 kV on 3.5 mm anode half gap bakable glass/ceramic materials 3D tracking w/o material in fiducial volume Beam View
Ultrapure Gas System:Continuous H2 UltraPurification System Commissioned 2004 cN2, cO2 < 0.01 ppm
Z>1 Capture (recoil nucleus) m Beam Capture Time m Stop Z>1 Capture Time Capture Time [ns] In situ Impurity Monitoring:TPC “Sees” High-Z Captures
Isotopically Pure “Protium” Target 1) Generate H2 from deuterium-depleted water (cd ~1 ppm) 2) On-site isotopic purifier 2006(PNPI, CRDF) World Record cd < 0.1 ppm
cD(Production) cD(Natural H2) = 0.0122 ± 0.0010 cD Monitoring: Data Analysis Approach • md can diffuse out of acceptance region: • signal proportional to number of md, and therefore to cD. m Decay Position md Diffusion Path Fits to Exponential Decay + Constant m-e Vertex Cut m Stop Position Fitted Rate + Offset [s-1] No Impact Parameter Cut 2004 Data Impact Parameter Cut [mm]
cD Monitoring: External Measurement • Measurements with New ETH Zürich Tandem Accelerator: • 2004 Production Gas, • cD = 1.44 ± 0.13 ppm D • 2005 Production Gas, • cD = 1.45 ± 0.14 ppm D • 2006 Production Gas (isotope separation column), • cD < 0.06 ppm D • The “Data Analysis Approach” gives a consistent result: • 2004 Production Gas, • cD = (0.0122 ± 0.0010) × (122 ppm D) • = 1.49 ± 0.12 ppm
Production Data (D-depleted Hydrogen) Calibration Data (Natural Hydrogen) l Extrapolated Result 0 D Concentration (cD) Correction for Deuterium:Zero Extrapolation l from fits to data (y = Nle-lt + B)
Beamline Muon-On-Demand Kicker Plates m detector m- TPC +12.5 kV -12.5 kV 50 ns switching time • Single muon requirement (to prevent systematics from pile-up) • limits accepted m rate to ~ 7 kHz, • while PSI beam can provide ~ 70 kHz • Muon-On-Demand concept • Muon-On-Demand concept mLan kickerTRIUMF rf design 2-Dec-2005 kicked Fig will be improved dc ~3 times higher rate
Consistency Studies 6 mm Inside TPC 2004 Data TPC fiducial cuts Start time fit Event selection cuts
Consistency Studies (continued) 2004 Data divided into 96 chronological groups
mCap and LS calculations preliminary • rad. corrections • Goldman (1972) • Czarnecki Marciano Sirlin (2006)private comm. preliminary MuCap agrees within ~1s with LS theory Thorough theory studies needed for next MuCap 1% stage !
mCap and gP preliminary • within one sigma of chiral prediction, no dramatic discrepancy • nearly independent of molecular physics (lOP) • has overlap with old OMC, barely with recent RMC result • final result (’06 and ’07 data) will reduce error to 7%
Summary and Plans • Preliminary results 2004 data preliminary mCap theory*LS 730 18 707 - 715 gP 6.95 1.09 8.26 0.23 • 2006 data and 2007 plans • 1010 events m- achieved in 2006 • 1010 events m+ and suppl. measurements in 2007 LS with 1% uncertainty • m+d proposal planned for 2007 • Ideas for ultrapure H2 TPC welcome *including Czarnecki et al. rad. corrections
Main Corrections to Lifetime Result 2004 Data (No Cut)
m- Production Data Observed Decay Rate Gondola Old Muon Stop Definition 1 • Strong “Gondola Effect”* *The “gondola effect” is a large (anomalous) variation with gondola number of the fitted muon decay rate.
Old Muon Stop Definition 3 • Rejected TPC stops (“Bad Tracks”) have the opposite trend. “All Tracks” in the old stop definition means a good linear fit to the track shape is not required, and the EH pixels do not have to be anywhere in particular in the track. The only cut is a fiducial one. “All Tracks” do not show a significant gondola effect!
Tom’s Version of the “Gondola Effect” • Largely reduced compared to mine, but still present.
1) Define a Region of Interest (ROI) of TPC data based on the muon entrance counters [Tentrance, Tentrance + 25 ms] New MIAS Muon Stop Definition 1 Goal of new stop definition: to be more robust against noise and distorted tracks, and to identify tracks that need more attention. 2) Within the ROI, find all groups of next-nearest-neighbor connected EL pixels, in pixel space, with at least one EH pixel.* “Island” of pixels “Raw data” pixels Pixels that are part of this island are indicated by a square around the dot. In this case, all pixels shown are part of the same island. The long line and large blue and green squares (1 each) are explained on the next slide. * “Pixel Space” is the 2-dimensional space of: (drift time divided by TDC400 clock period, anode number); it corresponds to spatial (y, z) coordinates.
New MIAS Muon Stop Definition 2 3) Identify if the island is a good stop (“IsTrack”). • Define some island characteristics: • maximum anode number of EL pixels (AnodeMaxEL) • maximum anode number of EH pixels (AnodeMaxEH) • minimum anode number of EL pixels (AnodeMinEL) • minimum anode number of EH pixels (AnodeMinEH) • These maxima/minima anode numbers (and similarly for the drift time dimension) are indicated by the large squares (green for EL pixels, blue for EH pixels). • An island is a track if: • AnodeMaxEL – AnodeMaxEH <= 2 • AnodeMinEH – AnodeMinEL >= 8 • In other words, “IsTrack” is a minimal cut and means: • the track cannot extend too far beyond the apparent stop point (EH pixels), • and it also must have a sufficient tail leading up to the stop point. If an island is found to be a track (IsTrack), then a line is fit to the pixels for possible cuts or beam (y, y’) studies. The (y, z) stop location is defined as that of the most downstream EH pixel, the one with the minimum drift time.
New MIAS Muon Stop Definition 3 4) If the island is not a track (“!IsTrack”), check if it is a spot (“IsSpot”) An island is a spot if: AnodeMaxEL – AnodeMaxEH <= 2 AnodeMinEH – AnodeMinEL <= 2 DriftTimeMinEH – DriftTimeMinEL <= 3 (?) DriftTimeMaxEL – DriftTimeMaxEH <= 3 (?) The (y, z) location of the spot is defined as the average of the EVH pixels if present, otherwise of the EH pixels. (This may be changed to be the average of the earliest EVH or EH pixels.)
New MIAS Muon Stop Definition 4 Location in x (strips dimension) Y (Drift Time) found from anodes • Stop x is taken to be the average of the strips that have a hit at the stop time (Tstop) determined from the anodes. • The maximum and minimum x of the muon stop are based on strips hit at Tstop, Tstop+1 and Tstop-1.
TPC Event Categories 2 Extra EL pixel in Region of Interest (ROI) Occasionally (~2% of good stops), there are one or more EL pixels, unassociated with any EH-containing island, and downstream of the beginning of the muon track.* Z (anode number) Z (anode number) Y (or Drift Time) Y (or Drift Time) * Most of the “extra EL pixels” upstream of the beginning of the track are merely from when the muon had not yet sufficiently slowed to leave a connected track.
TPC Event Categories 3 Many Extra EL pixels in Region of Interest (ROI) Very rarely (<10-4 per muon stop), there are 8 or more extra EL pixels. Most (~90%) point to the stop position. A gap (circled) of 2 or more pixels separates these from the EH-containing island. Z (anode number) Z (anode number) Y (or Drift Time) Y (or Drift Time) These are likely muon-proton scattering events, in which the recoiling proton has enough energy to make an EH pixel, and which can be mistaken for a good muon stop.
TPC Event Categories 4 Many Extra EL pixels in Region of Interest (ROI) Very rarely (<10-4 per muon stop), there are 8 or more extra EL pixels. A few (10%) do not point to the stop position. This is probably pileup undetected by the entrance counters. Z (anode number) Z (anode number) ? Y (or Drift Time) Y (or Drift Time)
TPC Event Categories This histogram shows the number of each of the indicated TPC events.
Fitted Rate vs. Category A higher rate is consistent with these events being muon-proton scatters out of the fiducial volume, some of which capture on high-Z material. This region will be zoomed in the next slide.
Fitted Rate vs. Category (zoom1) This region will be zoomed in the next slide. Selecting tracks with exactly 1 extra EL pixel in the ROI shows a very strong gondola effect.
Fitted Rate vs. Category (zoom2) Rejecting tracks with any extra EL pixels naturally shows the opposite effect than that highlighted in the previous slide. These show no gondola effect. Clearly we must be very careful about rejecting, even implicitly, muon stops based on extra EL pixels in the Region of Interest.
Residuals of Lifetime Fits Fit Function: Ne(t) = A e-lt + B IsTrack IsTrack with 1 extra EL pixel in ROI The decay rate (l) is fixed to that found in the IsTrack fit (left), and A and B are allowed to vary.
Residuals of Lifetime Fits Fit Function: Ne(t) = A e-lt + B Gondola 1 Gondola 5 Gondola 8 These are IsTrack with 1 extra EL pixel in ROI. l is fixed from the fit to all IsTrack events.
Spatial Distribution of Extra EL Pixels Z [mm] Y [mm]
Spatial Distribution of Extra EL Pixels wrt Muon Stop Position The distributions are indexed by the observed decay time of the muon (electron appearance time wrt the muon entrance time). 0 < TDecay < 1 ms 3 < TDecay < 4 ms 5 < TDecay < 6 ms Zextra EL pixel – Zmuon stop Yextra EL pixel – Ymuon stop 7 < TDecay < 8 ms 9 < TDecay < 10 ms The center of the EL distibution either moves higher in the TPC with time, or the extra EL pixels are associated with the electron. Zextra EL pixel – Zmuon stop Yextra EL pixel – Ymuon stop