Download

1 / 10
150 likes | 627 Views
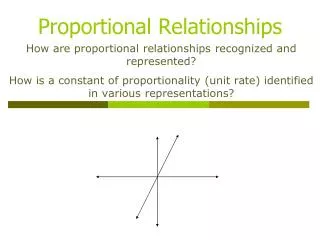
Identifying Proportional Relationships From graphs. Today, we will graph the information from the tables of values that we worked with yesterday in class. Our objective is to use a graph to identify if a relationship is proportional or not.

E N D
Identifying Proportional Relationships From graphs Today, we will graph the information from the tables of values that we worked with yesterday in class. Our objective is to use a graph to identify if a relationship is proportional or not.
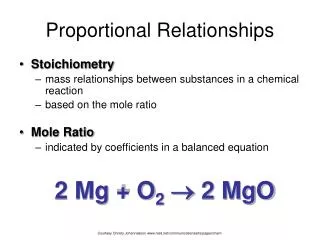
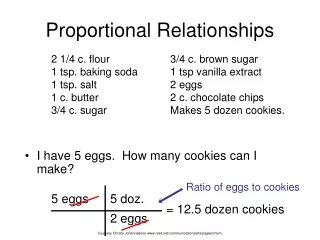
Example 1: The following chart shows how much money Alex earns for mowing lawns. Is the amount of money he earns proportional to the number of hours that he spends mowing? Since the simplified ratios were equal, this was a proportional relationship.
Let’s graph this proportional relationship from Ex. 1 on an xy-plane. We typically put time (hours) on the x-axis, and the earnings ($) on the y-axis. Set up the graph paper to fit the data in the chart. Plot points (x, y) from the table. y 56 42 Earnings ($) 28 14 Connect the points. x 1 2 3 4 5 Hours worked Describe the graph of this proportional relationship.
The graph of a proportional relationship: • is a straight line, AND • it passes through the origin, or point (0,0).
Example 2: Ticket Express charges $7 per movie ticket plus a $3 processing fee per order. Is the cost of an order proportional to the number of tickets ordered? Explain . Since all of the simplified ratios are not equal, there is NOTa proportional relationship between cost and the number of tickets ordered.
Now, let’s graph this nonproportional relationship from Ex. 2. Tickets ordered will be on the x-axis, and the cost ($) will be on the y-axis. y Plot points (x, y) from the table. 32 28 24 Cost ($) 20 16 12 8 4 Connect the points. x Describe the graph of this nonproportional relationship. 1 2 3 4 Tickets ordered
This graph shows a nonproportional relationship. It is a straight line, but it does not pass through the origin.
Example 3: Isaiah is selling candy bars to help raise money for his scouting troop. Isaiah sold two candy bars for $3. Complete the rest of the chart based on that information and find the unit rate for each.
Let’s graph this non-proportional relationship from Ex. 1 on an xy-plane. We typically put earnings ($) on the y-axis. Set up the graph paper to fit the data in the chart. y Plot points (x, y) from the table. 12 10 8 Money Earned($) 6 4 2 x Connect the points. 2 4 6 8 10 12 Chocolate Bars Sold Chocolate Bars Sold Describe the graph of this proportional relationship.
This graph shows a proportional relationship. It is a straight line, and it does not pass through the origin.