Download
1 / 21
210 likes | 362 Views
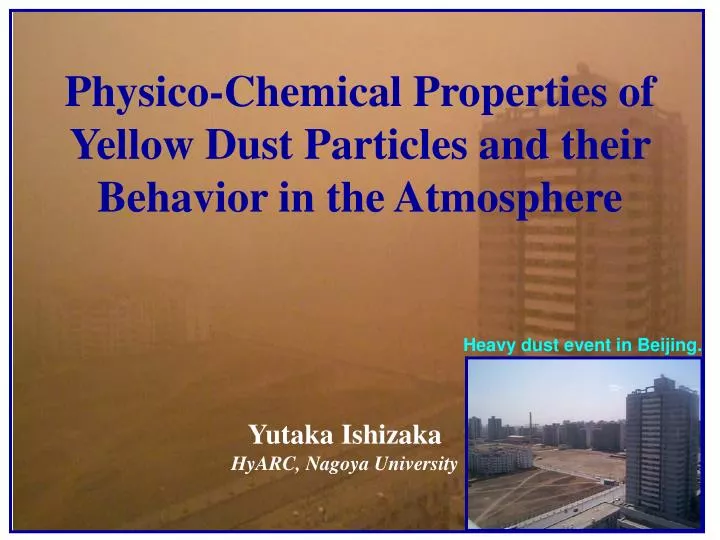
Physico-Chemical Properties of Yellow Dust Particles and their Behavior in the Atmosphere. Heavy dust event in Beijing. Yutaka Ishizaka HyARC, Nagoya University. Impact of Asian Dust Clouds on Climate and the Environment. Dust Brown Clouds. Land Use Change. Regional Forcing: Surface and

E N D
Physico-Chemical Properties of Yellow Dust Particles and their Behavior in the Atmosphere Heavy dust event in Beijing. Yutaka Ishizaka HyARC, Nagoya University
Impact of Asian Dust Clouds on Climate and the Environment Dust Brown Clouds Land Use Change Regional Forcing: Surface and Atmospheric Radiative Forcing, Rain Suppression, Photosynthesis Reduction Global Radiative Forcing Regional Climate Change: Hydrological Cycle; Precipitation, Weather Extremes/Warming or Cooling Global Climate Change Ecosystem Response, Agriculture, Water Availability, Public Health
Study on yellow dust particles using satellite data and their physico-chemical measurements Source regions Satellite Data Emission Rate Long range transport Physico-Chemical properties of dust particles Relationship with atmospheric processes
Yellow dust clouds Visible Image of Satellite GMS at 15JST on 13 April 1979.
Dust PM10 annual emission rates and contribution of types 1-3 sources on the total annual mean emission of PM10 dust with a US EPA formula. 1% 64% 35% (Xuan and Sokolik, 2002)
Longitude-height cross Sections of yellow dust clouds calculated from a numerical model. (In and Park, 2002)
Concentrations of TSP and aerosol chemical components in relation to distance from the KOSA source from 14 to 15 April 1998. Sampling locations. (Mori et al, 2002)
Mass size distribution of dust particles for heavy and light sandstorms. 105 104 103 102 dM/dlogD (μgm-3) 101 100 10-1 10-1 100 101 102 10-2 Diameter (μm)
Size distribution model of yellow dust Particles in the atmosphere: Number size distribution of dust and background aerosols were given by the zeroth-order logarithmic distribution (ZOLD) (Arao and Ishizaka, 1986)
Unfiltered direct solar radiation data obtained at 12 stations of the Japan Meteorological Agency were analyzed using size distribution model of yellow dust particles to estimate Kosa volume/mass in the atmosphere. Left Figure shows the relationship between Ångstrom’s turbidity coefficient and that of Yamamoto. Where l0:the extraterrestrial solar radiation I: the total radiation at the surface m: the optical air mass w: the water vapor content in the vertical air column (Arao and Ishizaka, 1986)
Volume distributions of yellow sand dust over Japan on 4-5 May 1981 (Arao and Ishizaka, 1986)
1 3 2 4 7 5 6 9 10 11 12 13 16 14 8 15 18 17 Index map of China with sampling locations Description of soils of China studied. (Hseung and Jackson, 1952)
Calcite & Gypsum are rich. A: Desert soil B: Light colored pedocal C: Dark colored pedocal D: Non-calcic soil E: Podsolic soil F: Red & yellow earth G: Latosol Functional continuity of mineral percentages in various soil groups in China. (Hseung and Jackson, 1952)
Yellow dust and reference (aerosol) samples were collected at Nagoya, Japan by means of two Andersen samplers and analyzed with an X-ray diffractometer. Mass size distribution of minerals found in the aerosol particles
Main origins of yellow sand dust: ① The desert soils near Taklamakan and Gobi deserts Illite, calcite and gypsum were abundantly found only in the dust sample. ② The soils in the upper drainage basin of Yellow River The relative weight fraction of kaolinite and illite in the dust samples were 0.3 to 0.5. Yellow dust and reference (aerosol) samples were collected at Nagoya, Japan by means of two Andersen samplers and analyzed with an X-ray diffractometer. Mass concentration and their percentage of the principal minerals in the dust and reference samples
Movement of dust clouds and main origins of yellow sand dust inferred from their clay mineral composition (Ishizaka and Ono, 1982)
KOSA particles coated with water solution. (Iwasaki et al., 1988)
EDX and morphological features for the dust particles Number frequency of elements found in Individual Asian dust-storm particles. Nagasaki, Japan. Okada et al.(1990) The dust particles collected at Nagasaki, Japan were present as mixed particles with water-soluble material mainly containing Ca and S.
(Zhang and Iwasaka, 1999) Samples: Yellow dust particles collected in Beijing under the northwest wind with the speedof 10 m/s in spring of 1996. Experiment ・Reagent thin-film test: Most of yellow dust particles did not reach with nitron-barium chloride multiple film. ・EDX analysis: Sulfur was hardly detected in yellow dust particles with the Energydispersive X-ray analyzer. Result Almost no sulfate is formed and nitrate is hardly formed on the surface of dust particles during their transport from source regions to Beijing.
Interaction Between Yellow Dust Particles and Air Pollutants Far from industry o o o o o o o o o o o o o o o o Pure Dust Particles o o o o o Industrial Area o Dust Particles internally mixed with sulfate and/or nitrate DesertArea