Download
1 / 45
450 likes | 454 Views
A Modeling Study on Typhoon Nari (2001): Landfall Characteristics. Ming-Jen Yang 1,2 , Hsiao-Ling Huang 1 , Da-Lin Zhang 2 1 National Central University, Taiwan 2 University of Maryland, USA. Heavy rainfalls induced severe flooding and societal damage !. Even Budda cannot save you!.

E N D
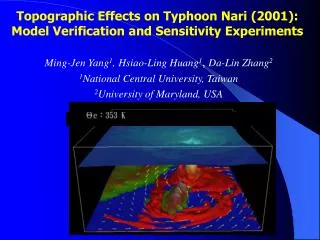
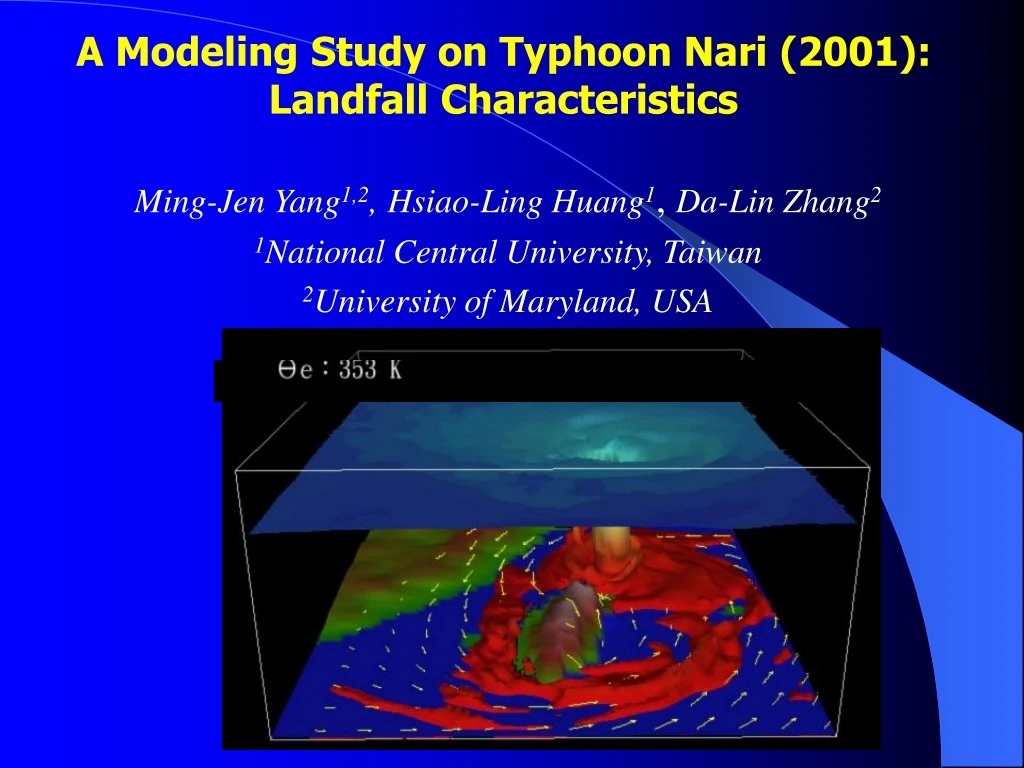
A Modeling Study on Typhoon Nari (2001): Landfall Characteristics Ming-Jen Yang1,2,Hsiao-Ling Huang1, Da-Lin Zhang2 1National Central University, Taiwan 2University of Maryland, USA
Heavy rainfalls induced severe flooding and societal damage ! Even Budda cannot save you! Water World !
Why studied Typhoon Nari (2001)? • Unique track • Slowly moving • Long duration • Warm ocean • Heavy rainfall • Severe flooding Sui et al. (2002) EOS article
Content: Part I: Model Verification Part II: Terrain Sensitivity Part III: Coupling with Runoff Model
D1: 54 km D2: 18 km D3: 6 km D4: 2 km MM5 Domains 31 levels In vertical
MM5 model physics (Control) TC initialization: Davis and Low-Nam (2001)
Track Comparison Simulation time (h) 12 24 36 48 60 72 84 Track error (km) 43.3 61.2 26.8 13.4 12.0 8.5 104.8
24-h rainfall on 09/16 6km MM5 2km MM5 OBS
24-h rainfall on 09/17 OBS 6km MM5 2km MM5
24-h rainfall on 09/18 OBS 6km MM5 2km MM5
3-day rainfall on 09/16~09/18 OBS 2km MM5 6km MM5
Relative Percentage of 3-Day Rainfall • MM5 overforecasts weak TC rainfall (<550mm/3day) but underestimates heavy TC rainfall (>550mm/3day) • As resolution increases, the simulated rainfall spectrum approached the observed
Average Rainfall on Taiwan Percentage wrt Rain Gauge OBS
3-Day Total Rainfall versus Terrain Height Rain Gauge OBS vortex circulation 2km MM5 topographic precipitation
Cloud Features CWB: 0916_0100 UTC CTL: 0916_0000 UTC Isosurface of Snow (0.01 g/kg) and Cloud Water (0.3 g/kg)
Sounding Comparison(within Eyewall) MM5 Simulation Observed Sounding
Horizontal Cross Section ofPressure Perturbations 0916_1400 UTC 5 ~ 6 hPa 8 ~ 9 hPa MM5 Simulation (wrt. aHorizontal Area Mean) Radar Retrieval (wrt. aStation Sounding) Courtesy of T.-C. Chen and Y.-C. Liou
TRMM Rainrate Comparison TRMM/PR: 0915/2328 UTC (10 km pixel) MM5: 0915/2100 UTC (6 km grid) Courtesy of W.-J. Chen
Radial Wind wrt RCWF Radar @ 3 km Height Obs Vr (6 km pixel) MM5 Vr (dx = 6 km) -45.1 -41.9 43.6 41.4 Courtesy of T.-C. Chen and Y.-C. Liou
MM5 Simulated Vr & Vt Nari at Sea (@ 3 km Height) Tangential Velocity Radial Velocity 1-h time-averaged result
MM5 Simulated Vr & Vt Nari Landfall (@ 3 km Height) Tangential Velocity Radial Velocity 1-h time-averaged result
D C B Over Ocean A Radar Echo (color) Condensational Heating (contour) 1-h averaged result After Landfall
D C B Over Ocean A Radar Echo (gray) Tangential Wind (contour) 1-h averaged result After Landfall
D C B Over Ocean A Radar Echo (gray) Radial Wind (contour) 1-h averaged result After Landfall
Horizontal Cross Section of low-level wind vector Vertical Cross Session of Vertical Velocity Gravity waves in squall lines (Yang and Houze 1995)
Summary ■After detailed comparisons, the MM5 simulated these features of Typhoon Nari reasonably well: the storm track, the landfalling location, the intensity change and shrinking of eyewall during landfall process, pressure gradient near the inner core, and many observed precipitation and kinematic structures ■Taiwan’s topography enhanced asymmetry on the kinematic structure with higher wave-number variations on the radail wind during the landfall process. ■After landfall, the vertical axis of eyewall and tangential wind tilted toward the terrain, with maximum heating located along the mountain slope. ■Two significant rainfall regimes are found: one with storm’s vortex circulation, and the other with topographic precipitation.
50% Ter 75% Ter NoTer 25% Ter 75% Terrain 50% Terrain 25% Terrain No Terrain
0.5Ter 0.75Ter 0.25Ter NT 777 620 928 798 CTL 100% Terrain 75% Terrain 50% Terrain 861 777 928 620 798 24-h Rainfall On 09/16 No Terrain 25% Terrain
Summary ■ The terrain impact on Nari’s intensity is quite linear, i.e., higher terrain producing a weaker typhoon. ■ However, terrain effects on Nari’s track and the accumulated rainfall on Taiwan are nonlinear. ■ Nari’s tracks near Taiwan result from the complicated interactions between the steering flow, Taiwan topography, and terrain-induced mesoscale forcings
Part III: River Runoff Simulation (Coupling MM5 with FLO-2D) In Cooperation with Ming-Hsu Li Ref: Li, M.-H.,M.-J. Yang, R. Soong, and H.-L. Huang, 2005:Simulating typhoon floods with gauge data and mesoscale modeled rainfall in a mountainous watershed. J. Hydrometeor., 6, 306–323.
The continuity and depth-averagedmomentum equations in the FLO-2D runoff model are: where h = river depth Ie= rainfall (Ps) excess over infiltration, Vx, Vy = the depth-averaged velocity in x- and y-dir., Sox, Soy = the bed-slope components in x- and y-dir., Sfx, Sfy = the friction-slope components in x- and y-dir.
Simulated River Depths by MM5 Rainfall MM5 Rainfall Gauge Rainfall
Summary ■The one-way coupling of MM5 with the FLO-2D runoff model is established and verified for Typhoon Nari (2001). ■ The MM5-predicted basin-averaged rainfalls are compared with those by rain gauge data. This comparisons in rainfall peak amounts and time lags are used to investigate the effect of rainfall forecast error on runoff prediction. ■ The error of flood prediction with the MM5 rainfall is mainly caused by the rainfall peak and timing differences, as a result of inherent uncertainties in the simulated rainfalls over a mountainous watershed during typhoon landfall periods.