Download
1 / 40
450 likes | 836 Views
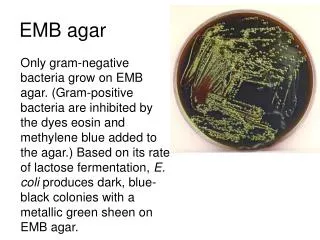
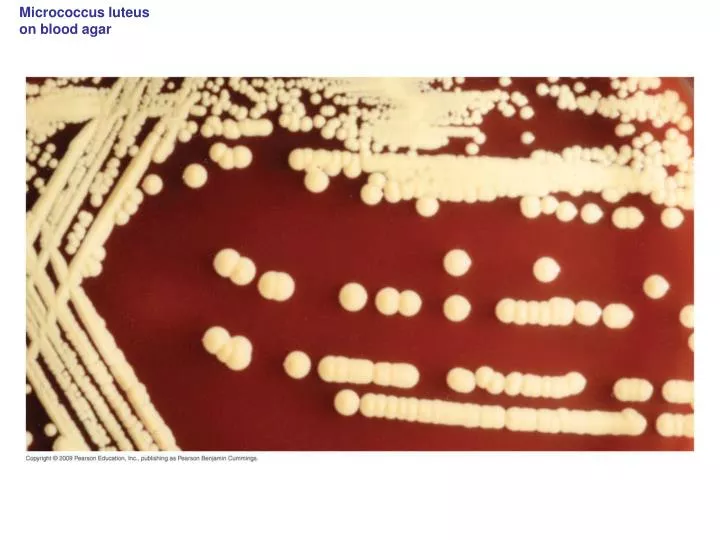
Micrococcus luteus on blood agar. A microbiologists view of the periodic table. Group. 11. 12. 13. 4. 1. 2. 14. 15. 16. 17. 3. 7. 8. 10. 6. 18. 9. 5. Period. Key:. 1. Essential for all microorganisms. Essential cations and anions for most microorganisms.

E N D
A microbiologists view of the periodic table Group 11 12 13 4 1 2 14 15 16 17 3 7 8 10 6 18 9 5 Period Key: 1 Essential for all microorganisms Essential cations and anions for most microorganisms Trace metals, some essential for some microororganisms 2 Used for special functions Unessential, but metabolized 3 Unessential, not metabolized 4 5 6
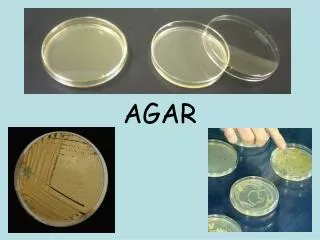
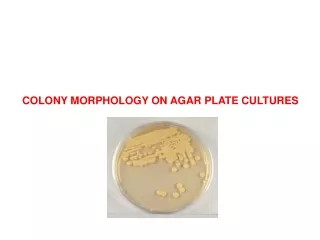
Isolated colonies at end of streak Confluent growth at beginning of streak Streaking for singles. Looking for single colony forming units
Enzymes lower activation energy Activation energy— no enzyme Substrates (A B) Activation energy with enzyme Free energy ∆G0= Gf0(C D) Gf0(A B) Products (C D) Progress of the reaction
Enzymes are recycled Glyceraldehyde-3-P Dihydroxyacetone-P Substrate Fructose 1,6-bisphosphate Products Active site Enzyme–substrate complex Free aldolase Free aldolase
Enzymes are specific for their substrates 3 dimensional structure determined by folding is dependent on side chain interactions determined by charge and hydrophobicity.
Leo the lion goes Gerrrrrr ReDox - gaining electrons = reduction losing electrons = oxidation Electron acceptor Electron donor Electron-donating half reaction Electron-accepting half reaction Formation of water Net reaction
E0(V) Redox couple -0.60 -0.50 -0.40 Some ReDox potentials of ETC -0.30 (1) -0.20 -0.10 0.0 +0.10 (2) +0.20 +0.30 +0.40 +0.50 +0.60 +0.70 (3) +0.80 +0.90 (1) H2fumarate2succinate2 ∆G0 = –86kJ ∆G0 = –163kJ (2) H2 NO3 NO2+ H2O ∆G0 = –237kJ (3) H2 O2H2O
Fig. 5-10-1 E0(V) Redox couple -0.60 -0.50 -0.40 -0.30 (1) -0.20 -0.10 0.0 +0.10 (1) H2fumarate2succinate2 ∆G0 = –86 kJ
NADH H Fig. 5-11 Reduced Oxidized NAD Nicotinamide Ribose Ribose Adenine Phosphate added in NADP
Reaction 1. Enzyme I reacts with electron donor and oxidized form of coenzyme, NAD+. Reaction 2. Enzyme II reacts with electron acceptor and reduced form of coenzyme, NADH. NADH binding site Active site NAD+ binding site Active site Fig. 5-12 Enzyme II Enzyme I NADH Electron acceptor Electron donor NAD+ Enzyme substrate complex NADH Electron acceptor reduced Electron donor oxidized NAD+
Bond energies of some important compounds Ester bond Anhydride bonds Ester bond Anhydride bond Adenosine triphosphate (ATP) Glucose 6-phosphate Phosphoenolpyruvate Anhydride bond Thioester bond Acetyl Coenzyme A Acetyl phosphate Acetyl-CoA
Anhydride bonds Ester bond Fig. 5-13-1 Anhydride bond Adenosine triphosphate (ATP) Phosphoenolpyruvate Anhydride bond Thioester bond Coenzyme A Acetyl Acetyl phosphate Acetyl-CoA
Intermediates in the biochemical pathway Energy-rich intermediates Using SLP to drivethermodynamically unfavorable reactions Substrate-level phosphorylation Energized membrane Less energized membrane Oxidative phosphorylation
STAGE I: PREPARATORY REACTIONS Isomerase Phosphofructokinase Hexokinase Glucose Fructose-6- Fructose-1,6- Glucose-6- You must use energy to free energy Aldolase STAGE II: MAKING ATP AND PYRUVATE Glyceraldehyde-3- 2 Glyceraldehyde-3-P dehydrogenase 2 Electrons 2 NAD+ 1,3-Bisphosphoglycerate 2 NADH 2 To Stage III Phosphoglycerokinase 2 3-Phosphoglycerate 2 2-Phosphoglycerate Enolase 2 Phosphoenolpyruvate STAGE III: MAKING FERMENTATION PRODUCTS Pyruvate kinase Pyruvate 2 NADH Lactate dehydrogenase Pyruvate decarboxylase Pyruvate:Formate lyase NAD+ To Stage II Acetate formate Formate hydrogenlyase CO2 Acetaldehyde Lactate H2 CO2 NADH Alcohol dehydrogenase To Stage II NAD+ Ethanol
Fig. 5-15-1 STAGE I: PREPARATORY REACTIONS Isomerase Phosphofructokinase Hexokinase Glucose Fructose-1,6- Glucose-6- Fructose-6-
Investment and return on investment Aldolase STAGE II: MAKING ATP AND PYRUVATE Glyceraldehyde-3- 2 Glyceraldehyde-3-P dehydrogenase 2 Electrons 2 NAD+ 2 1,3-Bisphosphoglycerate 2 NADH To Stage III Phosphoglycerokinase 3-Phosphoglycerate 2 2 2-Phosphoglycerate Enolase 2 Phosphoenolpyruvate
Fig. 5-15-3 STAGE III: MAKING FERMENTATION PRODUCTS Pyruvate kinase Pyruvate 2 NADH Lactate dehydrogenase Pyruvate decarboxylase Pyruvate:Formate lyase NAD+ To Stage II Acetate formate Formate hydrogenlyase CO2 Lactate Acetaldehyde H2 CO2 NADH Alcohol dehydrogenase To Stage II NAD+ Ethanol
R-Cysteine Cysteine-R Iron-sulfur clusters : a motif for electron transfer R-Cysteine Cysteine-R R Cysteine R Cysteine R Cysteine Cysteine R
E0(V) Complex I Fig. 5-20 –0.22 0.0 Complex II Fumarate Succinate CYTOPLASM 0.1 Complex III Complex IV 0.36 0.39 ENVIRONMENT E0(V)
chemiosmosis F1/Fo ATP synthase and the proton gradient F1 In b2 Membrane Fo C12 Out
Pyruvate (three carbons) The Balance sheet: The bottom line Energetics Balance Sheet for Aerobic Respiration Key C2 2 Pyruvate 4 ATP 2 NADH (1) Glycolysis: Glucose 2NAD 2 ATP Acetyl-CoA C4 4 ADP C5 to CAC to Complex I C6 (a) Substrate-level phosphorylation 2 ADP Pi 2 ATP 8 ATP Oxalacetate2 (b) Oxidative phosphorylation Citrate3 2 NADH 6 ATP Aconitate3 3 CO2 4 NADH FADH GTP (2) CAC: Pyruvate 4 NAD GDP FAD Malate2 Isocitrate3 to Complex I to Complex II (a) Substrate-level phosphorylation Fumarate2 1 GDP Pi 1 GTP 1 ATP 1 GDP 1 GTP 1 ADP 15 ATP ( 2) (b) Oxidative phosphorylation 4 NADH 1 FADH 12 ATP 2 ATP Succinate2 –Ketoglutarate2 Succinyl-CoA 38 ATP per glucose (3) Sum: Glycolysis plus CAC
Energetics Balance Sheet for Aerobic Respiration Key 4 ATP 2 NADH 2 Pyruvate (1) Glycolysis: Glucose 2NAD 2 ATP Fig. 5-22b 4 ADP C2 to CAC to Complex I C4 (a) Substrate-level phosphorylation C5 2 ATP 2 ADP Pi 8 ATP C6 (b) Oxidative phosphorylation 6 ATP 2 NADH 3 CO2 4 NADH FADH (2) CAC: Pyruvate 4 NAD GDP FAD GTP to Complex II to Complex I (a) Substrate-level phosphorylation 1 GTP 1 GDP Pi 1 GTP 1 ADP 1 ATP 1 GDP 15 ATP ( 2) (b) Oxidative phosphorylation 4 NADH 1 FADH 12 ATP 2 ATP 38 ATP per glucose (3) Sum: Glycolysis plus CAC
Fermentation Organic compound CO2 Carbon flow in respirations Electron transport/ Proton motive force Biosynthesis O2 Fig. 5-23 Organic e– acceptors Aerobic respiration Electron acceptors S0 NO3– SO42 Anaerobic respiration Chemoorganotrophy Inorganic compound CO2 Electron transport/ Proton motive force Carbon flow Electron acceptors Biosynthesis O2 S0 NO3– SO42 Chemolithotrophy Photoheterotrophy Photoautotrophy Light Electron transport Organic compound CO2 Carbon flow Carbon flow Proton motive force Biosynthesis Biosynthesis Phototrophy
Organic compound Fermentation CO2 Carbon flow in respirations Electron transport/ Proton motive force Fig. 5-23ab Biosynthesis O2 Organic e– acceptors Aerobic respiration Electron acceptors NO3– S0 SO42 Anaerobic respiration Chemoorganotrophy Inorganic compound CO2 Electron transport/ Proton motive force Carbon flow Electron acceptors Biosynthesis O2 S0 NO3– SO42 Chemolithotrophy
Fig. 5-23c Photoautotrophy Photoheterotrophy Light Electron transport Organic compound CO2 Carbon flow Carbon flow Proton motive force Biosynthesis Biosynthesis Phototrophy
Glutamate family Proline Glutamine Arginine -Ketoglutarate Fig. 5-25 Citric acid cycle Aspartate family Asparagine Lysine Methionine Threonine Isoleuine Oxalacerate Alanine family Valine Leucine Pyruvate Glycolysis Serine family Glycine Cysteine 3-Phosphoglycerate Phospho- enolpyruvate Aromatic family Phenylalanine Tyrosine Tryptophan Chorismate Erythrose-4-P
Fig. 5-26 Glutamate -Ketoglutarate NH3 Glutamate dehydrogenase Glutamine Glutamate NH3 Glutamine synthetase Glutamate Oxalacetate -Ketoglutarate Aspartate Transaminase 2 Glutamate Glutamine -Ketoglutarate Glutamate synthase
CO2 Amino group of aspartate Glycine Formyl group (from folic acid) Formyl group (from folic acid) Fig. 5-27 Amide nitrogen of glutamine Ribose-5-P Inosinic acid Aspartic acid NH3 CO2 Orotic acid Uridylate
Acetyl-ACP Malonyl-ACP Fig. 5-28 Acetoacetyl-CoA Palmitate (16 C) 4 C 6 C 14 C 8 C 12 C 10 C
Starting substrate The allosteric enzyme Control of pathways: feedback inhibition (noncompetitive inhibition) Enzyme A Intermediate I Enzyme B Intermediate II Feedback inhibition Enzyme C Intermediate III Enzyme D End product
Enzyme Active site Allosteric site Fig. 5-30 End product (allosteric effector) Substrate INHIBITION: Substrate cannot bind; enzyme reaction inhibited ACTIVITY: Enzyme reaction proceeds
Erythrose 4-phosphate Phosphoenol pyruvate Initial substrates 3 1 2 Fig. 5-31 DAHP synthases (isoenzymes 1, 2, 3) DAHP Chorismate Tyrosine Tryptophan Phenylalanine
Glutamine synthetase, a paradigm of allosteric control 100 Enzyme activity Glutamine Glutamine concentration Relative GS activity Glutamine 50 GS–AMP6 GS–AMP12 GS 0 3 6 9 12 0 AMP groups added AMP