Download
1 / 28
290 likes | 500 Views
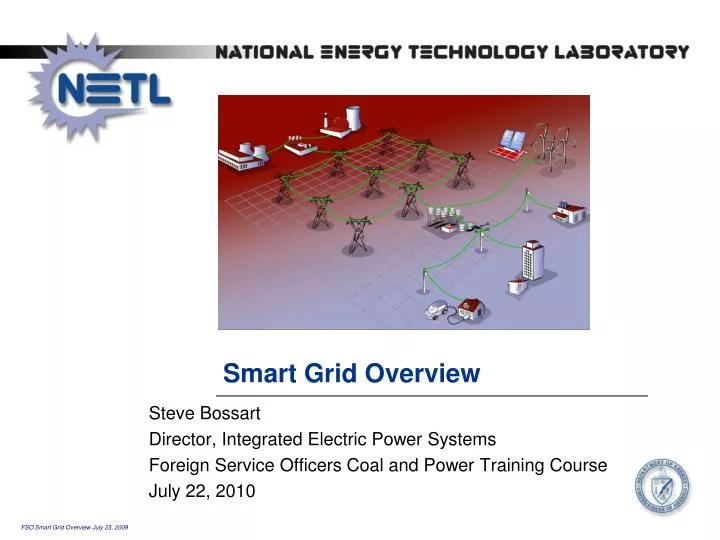
Smart Grid Overview. Steve Bossart Director, Integrated Electric Power Systems Foreign Service Officers Coal and Power Training Course July 22, 2010. Agenda. Case for Grid Modernization Smart Grid Vision, Technologies, & Metrics Smart Grid Activities What’s the Value Proposition?

E N D
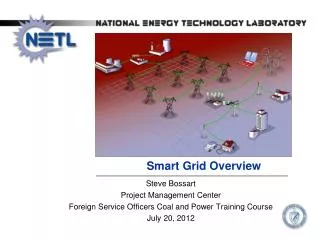
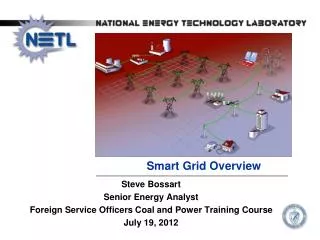
Smart Grid Overview Steve Bossart Director, Integrated Electric Power Systems Foreign Service Officers Coal and Power Training Course July 22, 2010
Agenda • Case for Grid Modernization • Smart Grid Vision, Technologies, & Metrics • Smart Grid Activities • What’s the Value Proposition? • Some Challenges and Risks • Questions
Why Modernize the Grid? Today’s grid is aging and outmoded Unreliability is costing consumers billions of dollars Today’s grid is vulnerable to attack and natural disaster An extended loss of today’s grid could be catastrophic to our security, economy and quality of life Today’s grid does not address the 21st century power supply challenges Adverse trends associated with the grid - Costs, reliability, peak loads, asset underutilization, TLRs, grid divorce The benefits of a modernized grid are substantial 4
Today’s grid - status quo is not an option • Aging • 70% of transmission lines are 25 years or older • 70% of transformers are 25 years or older • 60% of circuit breakers are 30 years or older • Outmoded • Designed in the 50s and installed in the 60s and 70s, before the era of the microprocessor. • Stressed • Never designed for bulk power shipments • Wholesale power transactions jumped 300% from 2000 to 2005. Insight Magazine, Oct. 2005
Role of the NETL Smart Grid Implementation Strategy Accelerate modernization of the national grid Define the vision for the Smart Grid Reach out to stakeholders to gain consensus Assist in identification and resolution of barriers Identify best practices and lessons learned Communicate success stories to stimulate deployment “Independent broker” consistent with Modern Grid concepts
What’s Different with Smart Grid • Consumer engagement with resources to solve power issues locally • Two-way power flow in Distribution • Two-way communications • As prices increase, local renewables will increase • Imperative to transform from passive to active control in Distribution • New ways for Distribution to become a Transmission resource • Potential to transform transportation sector
Smart Grid Principal Characteristics The Smart Grid will: Enable active participation by consumers Accommodate all generation and storage options Enable new products, services and markets Provide power quality for the digital economy Optimize asset utilization and operate efficiently Anticipate & respond to system disturbances (self-heal) Operate resiliently against attack and natural disaster 9 9
Smart Grid Key Success Factors The Smart Grid is MORE: Reliable Secure Resilient Economic Efficient Environmentally friendly Safe
Smart Grid Technologies • Integrated Communications
Current Smart Grid Activities American Recovery and Reinvestment Act • Smart Grid Investment Grants (100 projects) • $3.4 billion Federal; $4.7 billion private sector • 877 PMUs covering almost 100% of transmission • 200,000 smart transformers • 700 automated substations • 40 million smart meters • 1 million in-home displays • Smart Grid Demonstration Projects (32 projects) • $620 million Federal; $1 billion private sector • 16 storage projects • 16 regional demonstrations
Current Smart Grid Activities (continued) • Additional ARRA Smart Grid Activities • Interoperability Framework by NIST ($10M) • Transmission Analysis and Planning ($80M) • State Electricity Regulator Assistance ($50M) • State Planning for Smart Grid Resiliency ($55M) • Workforce Development ($100M) • DOE Renewable & Distributed Systems Integration • EPRI Smart Grid Demonstrations (6 projects) • Excel’s Smart Grid City, Boulder, CO • Smart Grid System Report to Congress • http://www.smartgrid.gov/resources
Smart Grid Metrics Reliability Outage duration and frequency, momentary disruption, power quality Security Ratio of distributed generation to total generation Economics Electricity prices, transmission congestion costs, cost of outages Efficient T&D electrical losses, peak-to-average load ratio Environmentally Friendly Ratio of renewable generation to total generation, emissions per kwh Safety Injuries and deaths to workers and public 16
Cost to Modernize $165B over 20 years $127B for Distribution $38B for Transmission ~$8.3B per year (incremental to business-as-usual) Current annual investment - $18B Benefit of Modernization $638B - $802B over 20 years Overall benefit to cost ratio is 4:1 to 5:1 Value Proposition EPRI, 2004 Benefit to Cost Ratio for West Virginia of 5:1 Benefit to Cost Ratio for San Diego of 6:1
Who are the Beneficiaries? • Utilities (What’s in it for my shareholders?) • Consumers (What’s in it for me?) • Society (What’s in it for us?) We get what we reward!
Utility Value Proposition Opportunities Rate of return Operational Benefits Outage restoration, billing, reduce T&D losses, optimize asset utilization, maintenance, planning Improved Customer Satisfaction Cost Risk of cost recovery Utilities are the engine for investment in Smart Grid
Consumer Value Proposition Opportunities More reliable service Reduce business loss Energy bill savings Transportation cost savings Information, control, options Sell resources into the market Cost “Consumer always pays” Is this compelling?
Is it compelling? Potential bill savings Average residential bill ~$100 / month Expected reduction from EE/DR 10% – 15% Potential savings $10 - $15 / month Bill increase to pay for SG $5 - $10 / month Potential fuel cost savings Assumed miles driven 10,000 mi/year Fuel cost (gas) 10 -15 cents/mile Fuel cost (KWh) @ 3 - 5 cents/mile 3 – 5 cents/mile Potential fuel cost savings $500 - $1,200/year Premium to purchase EV over gas $10,000 Consumer benefits alone may not drive Smart Grid implementation
Societal Value Proposition Opportunities Downward pressure on electricity prices Improved reliability reducing consumer losses Increased grid robustness improving grid security Reduced emissions New jobs and growth in GDP Revolutionize the transportation sector Reduce import of foreign oil Cost No incremental cost? Does the societal value proposition make it compelling?
Change Management A significant change management effort is needed: • Why do we need to change? • What is the vision? • Who’s in charge? • What is the value proposition? • Consumer education, alignment, and motivation is critical • Metrics needed for accountability and to monitor progress • Active leadership by stakeholder groups needed Move at the “Speed of Value”
Technical Challenges • Interoperability and scalability • Large number of consumers actively involved • Decentralized operations with 2-way power flow • Getting the communications right • “Future proofing” the technologies • Cyber Security • Conversion of data to information to action • Market driven Where will we find the skilled resources to solve these?
Regulatory Challenges • Time-based rates • Clear cost recovery policies • Policy changes that remove disincentives to utilities • Societal benefits included in business case • Increased utility commission workload • Consistency among state utility commissions • Potential cost of “carbon management” • Future proofing vs. stranded assets • Consumer privacy concerns • Least cost • Used and useful • New operating and market models
References Smart Grid Implementation Strategy www.netl.doe.gov/smartgrid/index.html Federal Smart Grid Website www.smartgrid.gov Smart Grid Clearinghouse www.sgiclearinghouse.org/