Download
1 / 30
320 likes | 361 Views
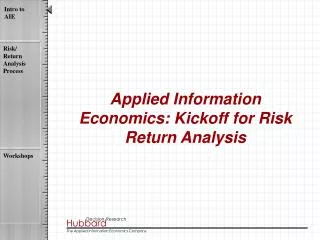
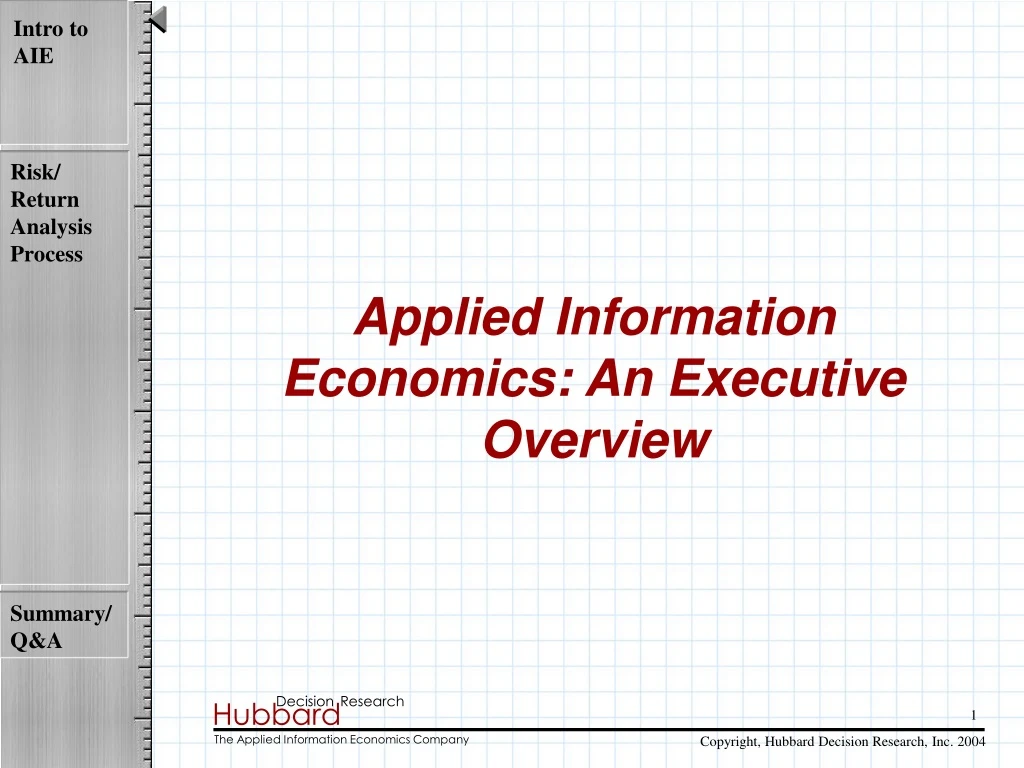
Applied Information Economics: An Executive Overview. Economics. Decision/Game Theory. Operations Research. Applied Information Economics. Modern Portfolio Theory. Options Theory. Statistics. Information Theory. What is AIE?.

E N D
Economics Decision/Game Theory Operations Research Applied Information Economics Modern Portfolio Theory Options Theory Statistics Information Theory What is AIE? Applied Information Economics (AIE) is the practical application of scientific and mathematical methods to quantify the value of IT-enabled business investments • “Quantifying the risk and comparing its risk/return with other investments sets AIE apart from other methodologies. It can substantially assist in financially justifying a project -- especially projects that promise significant intangible benefits.” The Gartner Group • “AIE represents a rigorous, quantitative approach to improving IT investment decision making…..this investment will return multiples by enabling much better decision making. Giga recommends that IT executives learn more about AIE and begin to adopt its tools and methodologies, especially for large IT projects.” Giga Information Group
Real Solutions to… • …the economics of information • …the economics of IT infrastructure • …the economics of risk • …the economics of flexibility • …the economics of productivity when headcount is not reduced • …the economics of portfolio prioritization • Bottom Line: AIE assesses and prioritizes IT investments based on quantitative and economically rational methods
Some AIE Users • U.S. Federal Government – • VA • Census • GSA • BEP • HUD • EPA • Booz-Allen & Hamilton • State of North Carolina • Giga Information Group • American Express • The Discovery Channel • The Axa Group – 6 major companies • The Banking Industry Technology Secretariat • Blue Cross Blue Shield of Illinois
AIE Benefits: For The Frugal • Measuring risk results in avoidance of investments which are likely to fail • Measuring risk allows managing risk and increased chance of success • Measuring all “intangible” benefits helps find methods to maximize benefits • Measurement of risk and all “intangibles” allows optimum prioritization of multiple proposed investments • Average payback on AIE analysis is well over 20:1 by avoiding risks and maximizing benefits • One client found AIE to be the highest return and lowest risk investment in their entire portfolio
Major AIE Processes • AIE methods impact 4 critical components of the decision-making process Technology & Business Forecasts Strategic Planning & Portfolio Management Business Cases for Individual Investments Ongoing Performance Metrics
AIE Building Blocks • AIE consists of many elements that build on each other • The most fundamental part of AIE is the measurement of risk & return on IT projects Infrastructure Value Models IT Change Economics IT Portfolio Management Optimization Methods Risk Return Analysis
1. Describe & Classify 2. Clarify Decision Model 3. Make Measure- ments 4. Conduct VIA 5. Conduct Risk/Return Analysis 6. Make Recommenda- tions Basic Risk/Return Analysis Organization Procedure Tools AIE Deliverables AIE
1. Describe & Classify 2. Clarify Decision Model 3. Make Measure- ments 4. Conduct VIA 5. Conduct Risk/Return Analysis 6. Make Recommenda- tions How Much Analysis? 1.0 Accept w/o Further Analysis .8 Abbreviated Deliverable Proceed with Risk/Return Calculation .6 No Classification Required Confidence Index .4 Reject w/o Further Analysis .2 0 100k 1M 10M 100M 10k Expected Investment Size ($)
Example Classification Accept without Further Analysis: 5. Lucent switch upgrade 7. Image Server Relocation 17. Enterprise IntraNet to all sites Success Factor Adjustments: 4. Network OS migration to Novell 5.x 10. Optimize Single Code Base Do Abbreviated Risk-Return Analysis: 6. DLSW Router Network Redesign 9. Extended Hours 18. Doc. Access Strategy 1 5 17 7 0.9 11 6 10 0.8 15 9 4 18 8 No Classification Needed 0.7 Confidence Index Do Full Risk-Return Analysis: 8. Pearl Indicator and Pearl I/O interface 11. Richardson Data Center Consolidation 15. MVS DB2 Tools 3 16 14 12 0.6 1 2 Reject; Consider Other Options: 1. Data Strategy 2. Enterprise Security Strategy 3. Remote Server Redundancy 12. MQ Series: Base 13. Development Environment 2000 (mf) 14. “Source Control” Source Code Mgmt 16. Enterprise InterNet 0.5 13 0.4 0.3 10 100 1,000 10,000 Expected Investment Size ($000)
1. Describe & Classify 2. Clarify Decision Model 3. Make Measure- ments 4. Conduct VIA 5. Conduct Risk/Return Analysis 6. Make Recommenda- tions Clarify The Decision Model • During Clarification we translate the “Intangibles” into measurable units • These are ultimately modeled in a spreadsheet
Examples of Clarification • Tools like “The Clarification Chain” are used to identify unit-of-measure variables hidden beneath the “intangible” label • I offer a challenge that given any intangible, I can clarify it and identify a method of measurement within 15 minutes (I’ve never lost) The “Intangible” Possible Meanings After Clarification • Less management overhead • Certain decisions are more accurate and faster “Employee Empowerment” “Information Availability” • Time and cost of searching is reduced • Certain costly errors are less frequent “Customer Relationship” • Increased repeatbusiness
1. Describe & Classify 2. Clarify Decision Model 3. Make Measure- ments 4. Conduct VIA 5. Conduct Risk/Return Analysis 6. Make Recommenda- tions Conduct Measurements • We use the variety of measurement methods previously discussed • We usually start with what we know now (i.e. calibrated estimates) • More elaborate measurements (large controlled experiments or surveys) are only taken if we can show they are economically justified
The Meaning of Measurement • Sometimes one believes that a thing is “immeasurable” only because they do not actually understand the concept of measurement • The “Measurement Theory” definition of measurement: “A measurement is an observation that results in information (reduction of uncertainty) about a quantity.” • Any “reduction of uncertainty” about a quantity can be of value ?
Real-world Measurements vs. Ideal Values Ideal Values: Point Real-world Meas. Normal Distribution Uniform Distribution Lognormal Distribution Hybrid 15% 85% Threshold confidence
Calibrated Estimates • Measuring your own uncertainty about a quantity is a general skill that can be taught with a measurable improvement • Studies show that most managers are statistically “overconfident” when assessing their own uncertainty • Training can “calibrate” people so that when they provide a 90% confidence interval, it still has a 90% chance of being right (even though it is subjective) When asked to provide a subjective 90% confidence interval, most managers provide a range that only has about a 40%-50% chance of being right Perceived 90% Confidence Interval Actual 90% Confidence Interval
17 21 45 21 71 65 75 65 58 68 152 25 Calibrated Probability Assessments • An Experiment with Giga Information Group 100% 90% “Ideal” Confidence Statistical Error 80% Giga Clients 70% Percent Correct 60% Giga Analysts 50% # of Responses 99 40% 30% 50% 60% 70% 80% 90% 100% Assessed Chance Of Being Correct
Other Scientific Methods • Probability distributions are also derived from standard statistical methods for: • Controlled Experiments • Random Sampling • Regression methods • Software metrics • Meta-analysis of data Note: These methods are only used when the effort is economically justified
1. Describe & Classify 2. Clarify Decision Model 3. Make Measure- ments 4. Conduct VIA 5. Conduct Risk/Return Analysis 6. Make Recommenda- tions Calculate the Value of Information • The value of additional information can be calculated for each uncertain variable in the analysis • Measurement efforts will be more productive by focusing on variables that matter the most (results are often surprising) • This method is based on the probability of a change in a decision with additional information and the difference in the value of the decision $$$ $
The Economic Value of Information The Decision Theory Formula: • What it means: • Information reduces uncertainty • Reduced uncertainty improves decisions • Improved decisions satisfy business objectives (by definition)
The IT Measurement Inversion Receives Most Attention Least Relevant to Approval Decisions • Costs • Initial Development Costs • Ongoing Maintenance/Training Costs • Benefits • A specific benefit (productivity, sales, etc.) • Utilization (when usage starts and how quickly usage grows) • Chance of Cancellation Economic Relevance Typical Attention Receives Least Attention Most Relevant to Approval Decisions See my article “The IT Measurement Inversion” in CIO Magazine (its also on my website at www.hubbardresearch.com under the “articles” link)
1. Describe & Classify 2. Clarify Decision Model 3. Make Measure- ments 4. Conduct VIA 5. Conduct Risk/Return Analysis 6. Make Recommenda- tions ROI 0% 50% 100% Conduct Risk/Return Analysis Administrative Cost Reduction 5% 10% 15% % Improvement in Customer Retention 10% 20% 30% Total Project Cost $2 million $4 million $6 million
Analyzing the Distribution ROI = 0% “Expected” ROI Risk of Negative ROI Probability of Positive ROI The “cancellation hump” -25% 0% 25% 50% 75% 100% 125% Return on Investment (ROI)
Plotting the Risk and Return Risk 40% A proposed IT investment with a 15% risk and 54% return 30% Probability of less than a risk-free return 20% X 10% Return 10% 20% 30% 40% 50% 60%
Example of Risk Effects 50% Region of Unacceptable Investments • These are real IT investments of $2M-$3M plotted against a client’s investment boundary • The 27% ROI investment is actually preferred to the 83% ROI investment 40% 30% Chance of a negative IRR 20% Region of Acceptable Investments 10% 0% 0% 50% 100% 150% 200% Expected IRR over 5 years Articles by Hubbard: “Hurdling Risk” CIO Magazine and “Risk vs. Return” InformationWeek (articles linked at www.hubbardresearch.com)
1. Describe & Classify 2. Clarify Decision Model 3. Make Measure- ments 4. Conduct VIA 5. Conduct Risk/Return Analysis 6. Make Recommenda- tions Make Recommendations • The recommendations include: • To accept or reject the investment • Possible modifications to the proposed investment • Various risk management tactics • Deliverables include • The written report • The spreadsheet • The presentation
Model the costs, benefits, “intangibles” “Calibrate” workshop participants Put ranges and probabilities into model Conduct the Value of Information Analysis Conduct empirical measurements Run Monte Carlo Assess risk/return 50% 40% 30% Risk 20% 10% ROI 0% 0% 100% 200% 300% -100% 400% 0% 50% 100% 150% 200% Average ROI “Full” RRA Overview Optimize Investment, Make Recommendations
Advanced Methods: Example • The Axa Group is doing a world-wide data center consolidation • Of the 11 data centers in Europe there are over 1013 possible consolidations • We formulated the problem as a type of “optimal spanning tree” with a dynamic programming algorithm - we narrowed the field down to the few most economically optimal ? England Germany Belgium Spain Switzerland France Portugal Austria Italy
Typical Client Engagements • Individual Risk/Return Analysis on an IT investment • 5 to 10 weeks depending on investment size • No license fee charged (client doesn’t retain use of tools) • Implementation of the AIE method • 10 to 14 weeks per major IT portfolio • License fee required • Ongoing assistance on a case-by-case basis • Outsourcing of the AIE analysis process can be negotiated • We have recently been offering retainer options for significant discounts on consulting fees and licenses
In Conclusion... • AIE is about getting the most out of the IT investment • Decisions would be very different - and much better - if intangibles, risk, redefined roles, and optimization methods were used • AIE is theoretically well-founded and has a measurable benefit • The problems AIE solves will only become more prevalent