Download
1 / 35
360 likes | 374 Views
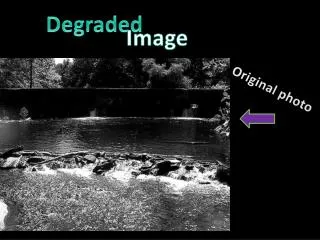
Degraded Water Reuse. Soil Science Society of America International Year of Soils Committee. General Topics Covered. Background: - Definition of degraded water - Water uses and types of degraded water - Need for degraded water reuse Case study:

E N D
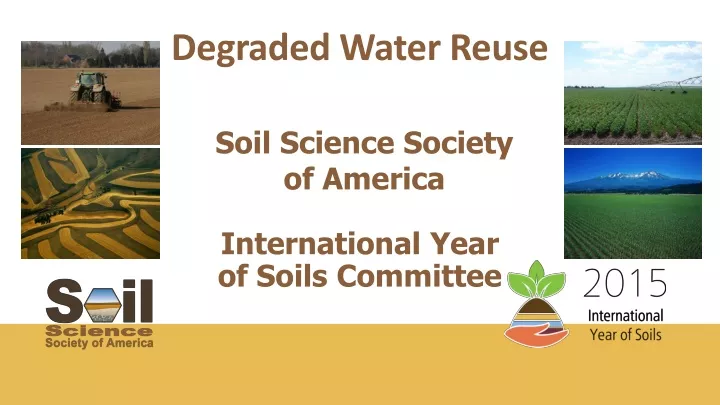
Degraded Water Reuse • Soil Science Society of America • International Year of Soils Committee
General Topics Covered Background: - Definition of degraded water - Water uses and types of degraded water - Need for degraded water reuse Case study: - Drainage water problem in the western San Joaquin Valley (WSJV) - Potential solution to problem - Impacts, ramifications, and sustainability of drainage water reuse on WSJV saline-sodic soil
“If there is magic on this planet, it is contained in water.” - Loran Eisely (The Immense Journey, 1957)
What is degraded water? A degeneration of water quality following its original intended use, where quality refers to the condition of chemical and physical properties such as, but not limited to, turbidity, pH, salinity, pathogens, metals, nutrients, organics, and temperature (Corwin and Bradford, 2008, JEQ 37:S-1-S-7).
Most Common Water Uses Agriculture Domestic Recreation Industry
Common Types of Degraded Water Agricultural runoff Drainage from irrigation Food processing wastewater Industrial wastewater Household “grey” water Municipal wastewater Urban stormwater Confined animal feeding operations (CAFO) wastewater
Global Water Availability*(Past Trend) From 1950 to 2000, the annual water availability per person as calculated on a global basis decreased from 16,800 m3 to 6800 m3 per year.* *Shillomanov, I.A. 1997. Comprehensive assessment of the freshwater resources of the world: Assessment of water resources and water availability in the world. World Meteorological Organization and Stockholm Environment Inst., Stockholm, Sweden.
Global Water Availability*(Predicted Trend) Status Water Supply 1995 2025 (m3/person) Population % of Total Population % of Total (millions) (millions) Scarce < 500 1077 19.0 1783 24.5 500 – 1,000 587 10.4 624 8.6 Stressful 1,000 – 1,700 669 11.8 1077 14.8 Adequate 3091 54.6 3494 48.0 Unallocated 241 4.2 296 4.1 Total 5665 100.0 7274 100.0 Estimates indicate that the world’s population living in conditions of water stress will increase from 41% in 1995 to 48% in 2025. *World Resource Institute. 2000. World resources 2000-2001: People and ecosystems: The fraying web of life. Oxford Univ. Press, New York.
Pollutants Degrading the World’s Water Supplies Pollutant* Primary Sources* Organic matter Industrial wastewater and domestic sewage Nutrients (e.g., NO3-N, P) Runoff from agricultural lands and urban areas Heavy metals (e.g., Hg, Cd, Zn, Pd, etc.) Industries and mining Microbes (e.g., cholera, Giardia, etc.) Domestic sewage, CAFOs, and natural rources Toxic organics (e.g., oils, pesticides, etc.) Wide variety of sources including industrial sites, automobiles, farmers, etc. Dissolved salts Leaching from agricultural soils or drawn into costal aquifers from overdrafting of ground water Acid precipitation and acidic runoff Coal combustion and mining, respectively Silt and suspended particles Soil erosion and construction activities Thermal pollution Dams and power plants (e.g., cooling towers) In general, pollution law and technologies have been able to control point source pollution, like factories and sewage treatment plants, but have not been able to effectively reduce nonpoint sources of pollution.** *UNEP/GEMS (1995), Shiklomanov (1997), Taylor and Smith (1997), and Revenga and Mock (2001). **Corwin, D.L., and S.A. Bradford. 2008. Environmental impacts and sustainability of degraded water reuse. J. Environ. Qual. 37:S-1-S-7.
Degraded Water as an Alternative Water Resource* “Today degraded waters are increasingly viewed as potential alternative water sources due to the increased demand on limited high quality water resources, the increased occurrence of drought, and the increased supply of degraded water.” *Corwin, D.L., and S.A. Bradford. 2008. Environmental impacts and sustainability of degraded water reuse. J. Environ. Qual. 37:S-1-S-7.
Degraded Water Reuse Case Study Long-term sustainability of drainage water reuse on the west side of California’s San Joaquin Valley (WSJV)
Why is drainage water reuse needed in California’s WSJV? • Recurring drought and urban water demands stress current freshwater supplies to the point where an alternative water source is needed • Drainage water is a disposal problem in WSJV • Reason: closure of Kesterson Reservoir in mid 1980s as a drainage water disposal site due to the discovery of deformities in water fowl found to be associated with Se in drainage water • 340,000 ha adversely affected by shallow water tables in WSJV, but no place to dispose of drainage water • Currently, evaporation ponds are used for drainage water but for every 10 ha of drained land, 1 ha is needed for the evaporation pond, which takes land out of productivity
Solution to Drainage Water Disposal Problem: Drainage Water Reuse • Drainage water is a potential means of reclaiming non-productive saline-sodic soils in WSJV • 1.7 million ha are highly saline (> 6 dS/m) and/or sodic (ESP>15). • Proposed solution • Use saline drainage water on marginally productive, saline-sodic soils to grow salt tolerant forage to support livestock as a means to (1) reduce drainage water volumes, (2) reclaim saline-sodic soils, (3) return lands to productivity, and (4) provide an alternative water resource for irrigation. • Concerns regarding drainage water reuse: • Sustainability • Spatio-temporal impacts on soil and crop yield/quality
Monitor Spatio-temporal Changes due to Drainage Water Reuse • Objective: Monitor spatial and temporal changes during reclamation of a saline-sodic soil with 3-5 dS/m drainage water.
Monitor Spatio-temporal Changes due to Drainage Water Reuse • Objective: Monitor spatial and temporal changes during reclamation of a saline-sodic soil with 3-5 dS/m drainage water. • Study site: 32.4-ha saline-sodic field within Westlake Farms. N California USA Westlake site Kings County
Monitor Spatio-temporal Changes due to Drainage Water Reuse • Objective: Monitor spatial and temporal changes during reclamation of a saline-sodic soil with 3-5 dS/m drainage water. • Study site: 32.4-ha saline-sodic field within Westlake Farms. • Study period: 1999-2011. Only data from 1999-2004 is shown because most significant changes occurred during this time period. August 1999
Monitor Spatio-temporal Changes due to Drainage Water Reuse • Objective: Monitor spatial and temporal changes during reclamation of a saline-sodic soil with 3-5 dS/m drainage water. • Study site: 32.4-ha saline-sodic field within Westlake Farms. • Study period: 1999-2011. Only data from 1999-2004 is shown because most significant changes occurred during this time period. • Chemical parameters monitored due to their influence on the quantity and quality of yield of a salt-tolerant forage crop (i.e., Bermuda grass): Salinity (ECe or electrical conductivity of the saturation extract), sodium (SAR or sodium adsorption ratio), B, and Mo.
Temporal Change of Field Means by Depth (1999-2004) • ECe: 11% decrease • SAR: 11% decrease • B: 21% decrease • Mo: 56% decrease
Spatio-temporal Change in ECe 0-0.3 m 0.3-0.6 m 0-0.3 m 0.3-0.6 m 0-0.3 m 0.3-0.6 m N • ECe increased with depth and decreased over time. • Leaching caused ECe to decrease over time, particularly in top 0.6 m and in the north. • Salinity accumulated in the south below 60 cm. 0.6-0.9 m 0.9-1.2 m 0.6-0.9 m 0.9-1.2 m 0.6-0.9 m 0.9-1.2 m ECe (mg/L) 1999 2002 2004 0 - 10 10 - 15 15 - 20 20 - 25 25 - 30 30 - 35 35 - 50
1999-2004 Spatial Gain & Loss in ECe 2004 Depth Increment (m)Mean SDMean SDF-test 0-0.3 13.0 7.5 11.2 5.5 0.0504* 0.3-0.6 20.2 5.3 16.5 7.7 0.0002* 0.6-0.9 22.5 6.5 21.5 10.0 0.4529 0.9-1.2 25.2 7.9 22.5 9.8 0.0329* 1999 -19.5 - -11 ECe (dS/m) change 0.3-0.6 m 0-0.3 m -11 - -6 N -6 - -3 -3 - 0 0 - 4 4 - 8 *indicates significant difference from 1999 to 2004 8 - 16 0.6-0.9 m 0.9-1.2 m
Spatio-temporal Change in SAR 0-0.3 m 0.3-0.6 m 0-0.3 m 0.3-0.6 m 0-0.3 m 0.3-0.6 m N 0.6-0.9 m 0.9-1.2 m 0.6-0.9 m 0.9-1.2 m 0.6-0.9 m 0.9-1.2 m 1999 2002 2004 • ECe and SAR patterns are quite similar. • Leaching decreased SAR over time, particularly in top 0.6 m and in the north. • Na accumulated in the south below 60 cm. SAR 0 - 15 15 - 30 30 - 45 45 - 60 60 - 75 75 - 90 90 - 128
1999-2004 Spatial Gain & Loss in SAR 1999 2004 Depth Increment (m)Mean SDMean SDF-test 0-0.3 28.2 16.5 22.8 14.1 0.0130* 0.3-0.6 51.4 12.9 41.3 21.3 0.0001* 0.6-0.9 59.0 16.6 56.9 26.5 0.6793 0.9-1.2 64.9 19.5 60.9 26.5 0.1914 -48 - -25 SAR change 0.3-0.6 m 0-0.3 m -25 - -18 N -18 - -11 -11- 0 0 - 7 7 - 14 * indicates significant difference from 1999 to 2004 14 - 25 0.6-0.9 m 0.9-1.2 m
Spatio-temporal Change in B 0-0.3 m 0.3-0.6 m 0-0.3 m 0.3-0.6 m 0-0.3 m 0.3-0.6 m N 0.6-0.9 m 0.9-1.2 m 0.6-0.9 m 0.9-1.2 m 0.6-0.9 m 0.9-1.2 m 1999 2002 2004 • Leaching of B over time, particularly in top 0.6 m and in the north. B (mg/L) 0 - 5 5 - 10 10 - 15 15 - 20 20 - 25 25 - 30 30 - 45
1999-2004 Spatial Gain & Loss in B -21.5 - -9.7 B (mg/L) change 0.3-0.6 m 0-0.3 m 1999 2004 Depth Increment (m)Mean SDMean SDF-test 0-0.3 17.0 8.2 9.1 5.9 0.0001* 0.3-0.6 19.0 5.6 14.2 7.5 0.0001* 0.6-0.9 17.5 4.8 16.7 7.3 0.2346 0.9-1.2 17.9 6.3 16.4 7.3 0.1421 -9.7 - -5.9 N -5.9 - -2.1 -2.1- 0 0 – 4.3 4.3 – 8.1 * indicates significant difference from 1999 to 2004 8.1 – 19.4 0.6-0.9 m 0.9-1.2 m
Spatio-temporal Change in Mo 0-0.3 m 0.3-0.6 m 0-0.3 m 0.3-0.6 m 0-0.3 m 0.3-0.6 m N 0.6-0.9 m 0.9-1.2 m 0.6-0.9 m 0.9-1.2 m 0.6-0.9 m 0.9-1.2 m 1999 2002 2004 • Leaching of Mo over time through entire profile (0-1.2 m). Mo (μg/L) 0 - 500 500 - 600 600 - 700 700 - 800 800 - 900 900 - 1000 1000 - 3050
1999-2004 Spatial Gain & Loss in Mo -2125 - -1080 Mo (mg/L) change 0.3-0.6 m 0-0.3 m 1999 2004 Depth Increment (m)Mean SDMean SDF-test 0-0.3 862.3 532.5 550.0 510.0 0.0001* 0.3-0.6 750.5 430.2 360.0 343.0 0.0001* 0.6-0.9 780.5 338.9 294.2 250.1 0.0001* 0.9-1.2 946.9 450.7 278.3 272.2 0.0001* -1080 - -525 N -525 - -245 -245- 0 0 – 315 315 – 1200 * indicates significant difference from 1999 to 2004 1200 – 1630 0.6-0.9 m 0.9-1.2 m
Se (2004) Potenial Se Buildup Se (μg/L) 0 - 50 50 - 100 100 - 200 0.3-0.6 m 0-0.3 m 200 - 300 1999 2004 Depth Increment (m)Mean SDMean SD 0-0.3 8.8 12.7 57.1 57.1 0.3-0.6 14.0 8.5 77.0 77.0 0.6-0.9 12.9 9.2 70.0 70.1 0.9-1.2 14.1 13.9 80.9 80.9 300 - 400 400 - 500 N 500 - 725 0.6-0.9 m 0.9-1.2 m
2004 1999 Spatial Change in pHe pHe 0.3-0.6 m 0.3-0.6 m 0-0.3 m 0-0.3 m 6.7 - 7.15 1999 2004 Depth Increment (m)Mean SDMean SDF-test 0-0.3 7.6 0.3 7.7 0.4 0.0825 0.3-0.6 7.6 0.2 7.6 0.4 0.8068 0.6-0.9 7.6 0.2 7.8 0.3 0.0025* 0.9-1.2 7.6 0.2 7.9 0.3 0.0001* 7.15 - 7.3 N 7.3 - 7.45 7.45 - 7.6 7.6 - 7.75 7.75 - 7.9 7.9 - 9 0.6-0.9 m 0.6-0.9 m 0.9-1.2 m 0.9-1.2 m * indicates significant difference from 1999 to 2004
Prognosis Field site was non-productive in 1999. By 2004 the application of drainage water to the saline-sodic field improved soil quality, supporting a forage crop with 100 head of livestock. March 2000 Westlake site – south end March 2004 5-year results show the reuse of 3-5 dS/m drainage water reclaimed saline-sodic soil and brought marginally productive land back into production. Westlake site – south end
Positive Ramifications of Drainage Water Reuse on Saline-Sodic Soil • Reclamation of saline-sodic soil • ECe leached from top 1.2 m, especially 0-0.6 m • Na leached from top 1.2 m, especially 0-0.6 m • B leached from top 0.6 m • Mo leached from top 1.2 m • Reduced drainage volumes thereby reducing land set aside for evaporation ponds • Returned marginally productive land back to productivity • Provided an alternate water source
Potential Negative Impacts • Evidence of accumulation of Se in the north. • Increasing pH in the south, particularly at lower depths (below 60 cm) • NOTE: The accumulation of salt, Na, and B below 60 cm in the south is a consequence of the dispersion of clay by Na, creating a zone of low permeability. Appling a Ca amendment in the south and leaching will rectify this problem.
Caveat Even though the reuse of drainage water on WSJV saline-sodic soil results in many positive effects, intermittent monitoring of Se and pH is advisable.
Suggested Reading General degraded water reuse: Asano, T., F. L. Burton, H. L. Leverenz, R. Tsuchihashi, and G. Tchobanoglous. 2007. Water Reuse – Issues, Technologies, and Applications by McGraw Hill, New York, NY. Corwin, D. L., and S. A. Bradford. Environmental impacts and sustainability of degraded water reuse. J. Environ. Qual. 37:S-1 – S-7. 2008. Monitoring the long-term impact and sustainability of drainage water reuse: Corwin, D. L., S. M. Lesch, J. D. Oster, and S. R. Kaffka. Monitoring management-induced spatio-temporal changes in soil quality with soil sampling directed by apparent soil electrical conductivity. Geoderma. 131:369-387. 2006. Corwin, D.L. 2012. Field-scale monitoring of the long-term impact and sustainability of drainage water reuse on the west side of California’s San Joaquin Valley. J. Environ. Monit. 14:1576-1596.
The UN Declared 2015 as the International Year of Soils (IYS) to bring more attention to this important natural resource. The Soil Science Society of America celebrates IYS and is happy to bring you this presentation. We hope you take the time to learn more about soils at the many resources listed at the end of this presentation, as you learn more about how… Soils Sustain Life
Thank you for listening!For further information, visit: Soils.org/discover-soils – information about all things soil! Soils4teachers.org – Lesson plans, activities, etc. for teachers Soils4kids.org – activities for the K-12 audience Follow us on facebook.com/iheartsoil Soils sustain life!