Download
1 / 16
160 likes | 222 Views
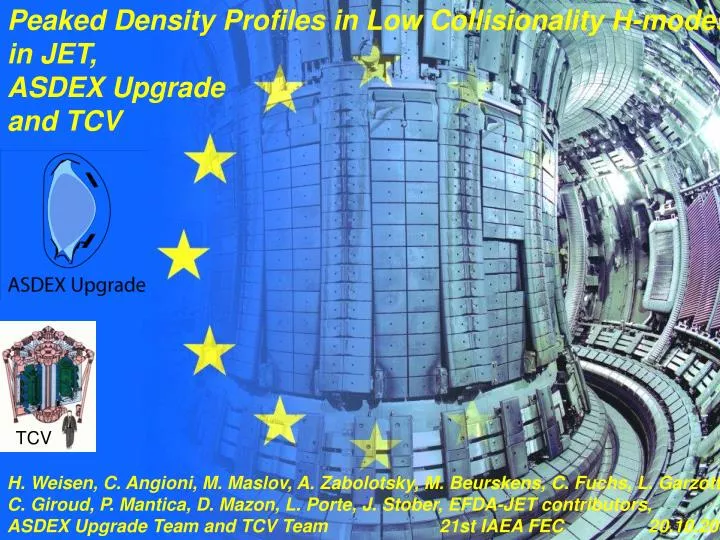
Peaked Density Profiles in Low Collisionality H-modes in JET, ASDEX Upgrade and TCV. TCV.

E N D
Peaked Density Profiles in Low Collisionality H-modes in JET, ASDEX Upgrade and TCV TCV H. Weisen, C. Angioni, M. Maslov, A. Zabolotsky, M. Beurskens, C. Fuchs, L. Garzotti, C. Giroud, P. Mantica, D. Mazon, L. Porte, J. Stober,EFDA-JET contributors, ASDEX Upgrade Team and TCV Team 21st IAEA FEC 20.10.2006
OUTLINE Peaked Density Profiles in Low Collisionality H-modes in JET, ASDEX Upgrade and TCV • Motivation • AUG-JET combined density profile database • Most relevant and significant variables governing density profile peaking • Regressions and ITER extrapolations • Density profiles under intense electron heating • Impact on fusion performance • Conclusions
Importance of density peaking • Peaked density profile more fusion powerPfusnDnTsv n2T2 p2 for 7T20 keV • Peaked density profiles more bootstrap current. • Peaked density profiles higher core density for given edge density. • Peaked density profiles may compensate for lower than expected density limit in ITER (Borrass, NF 2004) • Peaked density profiles prone to neoclassical impurity accumulation at high Z and/or at low anomalous transport (e.g.C.Giroud, EX / 8-3)
Separate studies in AUG & JET • Density profiles in ELMy H-mode more peaked at low collisionality neff=10-14ZeffR0 neTe-2 (SI,eV) C. Angioni et al, PRL 90 (2003) 205003 H. Weisen et al, NF 45 (2005) L1-L4 neffat r=0.5 COMBINED DATABASE (2006) 277 JET H-modes, 343 AUG H-modes Reduced colinearities between physics variables
Dimensionless physics variables • Fundamental parameters from drift wave theory r* = 4.3710-3 (meffTe)1/2/(aBT ) neff = 210-14ne R0/Te2 b= 4 10-3p/BT2 (as used by ITPA) • Dimensionless NBI source term from diffusion-convection equation in steady state • Additional variables: NGR ,q95,Te(r=0.2)/Te, d, (R0) • Flux due to edge neutrals in core region poorly known, but typically one order of magnitude below NBI flux (Zabolotsky NF 2006, Valovic NF lett. submitted). Not included here.
Consistent definition for peaking • Peaking factor: ne(r=0.2)/ne • But different diagnostics & different analysis on JET and AUG systematic errors large errors on regressions • Method: JET density profiles from interferometry remapped onto (virtual) AUG interferometer geometry, JET & AUG inverted using same geometry and same set of basis functions • JET original and remapped/inverted agree within 2%, validates virtual interferometer method. • Systematic errors may exist for other variables. • Introduced R0 as a device label. • If regressed variable scales with R0 that may indicate possible systematic errors in variables or inadequate choice thereof
Bivariate correlations • Wide variety of discharges conditions, with and without beam fuelling • Correlation of lnneff with NGR=ne/nGR is strong • Correlations of lnneff with G* and r* in combined database are weak 1 0.01 0.25 ITER 0.2 ITER 0 0 0.1 1 10 0.1 1 10 0.1 1 10 ITER
Bivariate correlations • Density peaking increases as neff drops, even in absence of NBI fuelling • Greenwald fraction nearly as correlated with density peaking as ln(neff) • Peaking in NBI-only discharges correlates with source parameter • Correlations with r*, q95,Te(0.2)/Te, dand wcetEare insignificant 2 2 2 0.52 ITER ITER ITER 1 1 1 0.1 1 10 0.2 1 0 0.3 neff
Multivariate regressions • ne2/ne=a0+iaiXi and ne2/ne=a0iXiai • 1 ne2/ne2 both forms equivalent • Tested many combinations of variables • Criteria*: • Statistical relevance of variable i StRi=aiSTD(Xi)/STD(ne2/ne) (How much does the variation of variable i contribute to the variation of ne2/ne?) • Statistical significance StSi=ai /STD(ai)(How well is the coefficient of variable i determined?) • RMSE of fit(How good is the fit?) * O. Kardaun, Classical Methods of Statistics, Springer Verlag, 2005
Multivariate regressions • Strong correlation between neff and NGR regress with only one and both, with and without device label R0 (details: see poster/paper EX/8-4 or C.Angioni NF lett. submitted) • Summary of multivariate study: • neff is the most relevant whenever included in a fit (mostly also most significant) • G* is relevant and significant whenever included • NGR, R0 and/or r* become significant and relevant only if neff is excluded • b may be significant or not depending on other variables. Small contribution. • q95,Te(r=0.2)/Te, d always insignificant and irrelevant
Multivariate regressions EXAMPLE • All fits including neff predict peaked profile for ITER ne2/ne >1.4 • All fits excluding neff predict flat profile for ITER ne2/ne ~1.2 • However theory (dimensionless scaling) and appearance of strong R0 dependence when neff omitted, suggest that it is wrong to exclude neff. • JET/AUG study therefore suggests that ITER will have ne2/ne >1.4 ne2/ne = 1.350.015 –(0.120.01)lnneff +(1.170.01)G* – (4.30.8)b ITER: 1.45
Other parameters • Combined database does not (yet) have Ti and local shear, nC, but subset of JET data does. • Impurities generally not more peaked than electrons, carbon even significantly less (Giroud EX/8-3). • No correlation of ne2/ne and li or local magnetic shear from polarimetry (at odds with theory and with L-mode results elsewhere) • No correlation between ne2/ne and Te2/Te (at odds with theory) • Evidence for thermodiffusion :weak dependence on Ti/Te in JET subset • Ti/Te influence qualitively consistent with theory: low Ti/Te flatter profiles • Coefficient for source in fit for R/Ln at mid-radius provides experimental value for c/D~1.5 consistent with anomalous transport theory (Garbet, 2004) fnb=Pnbi/Ptot Rne/ne=0.970.34-(0.650.1)lnneff+(1.460.63)DG*/c +(0.650.4)Ti/Te ITER:Rne/ne2.6, ne2/ne 1.46
Peaked, purely electron heated H-modes with bN=2 in TCV • Theory suggests that strong TEM may reduce or completely remove density peaking by outward thermodiffusion (Garbet, PPCF 2004) • Flattening with core ECRH observed in several devices, i.e. TCV L-modes (Zabolotsky EX/P3-7) and often attributed to TEMs. • Suggest a-heated ITER may have flat density profile • Flattening not seen in JET ICRH H-modes, possibly due to low power • Recent 1.5 MW ECRH-heated TCV H-modes at neff0.4 are peaked despite Te/Ti 2 at bN 2 • (L. Porte, EX/P6-20) • Weak Te/Ti influence on JET and these TCV results suggest thermodiffusive density flattening not significant in ITER, which will be closer to equipartition. OH ECRH TCV H-modes
Implications for fusion power • Pfus increases by 30% for ne2/ne=1.46 (ITER)at constant b and nD,T • For inductive reference Q=10 scenario (Polevoi 2003), auxiliary heating can be reduced from 40MW with flat profile to 15MW. • Q~30 if tE unchanged! • No correlation between ne2/ne and dimensionless global energy confinement time wcetE: • we expect current confinement predictions for ITER to hold, even if density peaking has is not explicitly accounted for in scaling laws for tE Ti profile as in inductive reference scenario assumed Improvement less strong if Ti profile is broader
Pressure profile merit factor • Fusion power for fixed b maximized for dlnsv/dlnTi=2 (around 10keV) • pfus p2, Pfus p2dV =p2V • Pressure profile merit factor p2/p2 • Density profile contribution to merit factor is JET ITER ITER • p2/p2and density contribution increase towards lower collisionalities • Effect of density peaking not cancelled by temperature flattening • Regression for ITER : p2/p2 ~1.55 and p2T2/(p2T2)1.25
Conclusions • Dominant contribution to density peaking in H-mode is anomalous • Collisionality is most significant variable • NBI fuelling in JET and AUG also significant • Scaling with neff , Te/Ti and beam source consistent with D/ceff~2/3 • Scaling does not follow simple theoretical expectations with q95,li,Te(0.2)/Te • NBI-free, ECH heated H-modes in TCV with bN=2 and Te/Ti=2 show that peaking is not suppressed by electron heating • Extrapolations to ITER predict ne2/ne 1.4 • Pressure profile merit factors p2/p2 and p2T2/(p2T2)increase towards low neff similarly to ne2/ne • ~30% extra fusion power due to density peaking in ITER inductive reference scenario (fixed b and nD,T)