Download
1 / 15
150 likes | 158 Views
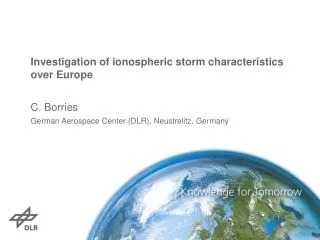
This research uses an advanced algorithm to retrieve high-resolution Total Electron Content (TEC) and electron density maps over Finland, using observations from a dense GNSS network. The results indicate the potential for highly accurate three-dimensional imaging of the ionosphere, with applications in ionospheric monitoring, storm warning, and GNSS correction services.

E N D
Juha-Pekka Luntama Finnish Meteorological Institute Cathryn Mitchell, Paul Spencer University of Bath 4th European Space Weather Week, 5 – 9 November, 2007 Mesoscale ionospheric tomography over Finland
Outline 1) Introduction 2) MIDAS algorithm and Finnish GNSS network 3) Global and mesoscale retrievals 4) Validation of the results 5) Summary and next steps
Introduction • Currently many services are providing global TEC maps in NRT (IGS, SWACI, JPL, …) based on observations from globally distributed GNSS stations (e.g. IGS, EUREF, …) • Number of IGS and EUREF GNSS stations is low at auroral region => resolution of the global maps is limited at the area where the ionosphere is very dynamic • Dense GNSS networks available in Scandinavia – already used for NWP in the EUMETNET E-GVAP framework • Our objective is to retrieve high resolution TEC and electron density maps based on these observations • Test data collected in December 2006 • This work is done in collaboration between University of Bath and FMI
Multi-Instrument Data Analysis System (MIDAS) • MIDAS is an advanced algorithm developed by University of Bathfor imaging the Earth's ionosphere using data from various ground and space-based instrumentation. • Line integral observations of the total electron content (TEC) obtained from a network of ground-based and space-based GPS receivers may be assimilated into the algorithm along with point estimates of the local electron density. • The resulting reconstructions provide a highly accurate three-dimensional image of the Earth's ionosphere and its evolution in time.
GPS ray path intersections within the grid Level height = 300 km
It was a dark and stormy night… IMAGE Magnetogram on 14 - 15 Dec 2006
Resolution enhancement with regional observations IGS Regional 15 December 2006, 02:00
High resolution TEC maps 14 – 15 Dec, 2006 Question: Do these maps represent the real ionosphere?
Validation opportunity:Ionospheric Tomography Chain observations
Intercomparison on 15 Dec 2006 at 02:45 Ionospheric Tomography Chain projection plane
Summary • These are the first results from a new ionospheric tomography testing in Finland • The results indicate that mesoscale ionospheric tomography can provide electron density distributions with very high horizontal and temporal resolution • Current results are based on using only ground based GPS observations => vertical resolution and accuracy of the height information is limited • Real time data streaming from the GNSS network will be started before the end of the year => development of NRT user service feasible • Some potential application areas: • ionospheric monitoring, storm warning, and correction service for GNSS applications • GNSS ionospheric error and scintillation forecasting research
Next steps • Improve vertical resolution: • Use also GLONASS observations (routinely available from the Geotrim network) • Ingest spaceborne RO soundings • Combine with other types of observations => data assimilation • Validation of the high resolution tomography maps is a challenge => processing of more test cases => a rigorous error analysis => analysis of the impacts on independent GNSS receivers (IGS, EUREF) => careful validation with independent observations (ionospheric tomography chain, ionosonde, EISCAT, …)