Download

1 / 12
120 likes | 125 Views
This milestone update includes updated data on population estimates, protected lands, sewer service areas, MS4 boundaries, high-resolution land use change hot spots, and moderate-resolution land use change. The update provides options for updating Phase III WIP land use and includes a consensus recommendation for updating MS4s, sewer service areas, population projections, and population estimates.

E N D
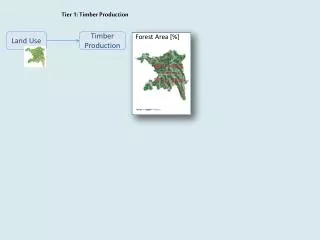
Milestone Land Use Recommendations October 15, 2019 WQGIT Call Peter Claggett Research Geographer, U.S. Geological Survey
2019 Milestone Land Use Updated Data Population Estimates (from 2016 ed. to 2018 ed.) Population Projections (VA, NY, DE, MWCOG, and BMC) Protected Lands (from 2016 ed. to 2018 ed.) Sewer Service Areas (51 counties/cities) MS4 Boundaries (VA only) High-resolution (1m) land use change “hot spots”, 2013 - 2017 (DC, DE, MD, NY, PA, WV) Moderate-resolution (30m) land use change from NLCD, 2011/13 - 2016 (VA)
Options for updating Phase III WIP land use (2014 – 2025): • Update with 2017 Ag Census only. • Same as #1 with added updates to Sewer Service Areas (SSAs) and MS4s. • Same as #2 with added updates to 2025 Population Projections and 2014 - 2017 Population Estimates: • Population Estimates updated for all counties; or • Population Estimates updated for counties with new projections; or • Population Estimates updated for all counties with 2025 projections adjusted by the ratio of 2017 housing units (derived from 2017 population estimates) to interpolated 2017 housing units used for the WIPs. • Same as #3 with added update of 2016 land use based on NLCD everywhere. • Same as #3 with added update of 2016 land use based on NLCD in Virginia and 2017/18 land use based on High-res Hot Spots elsewhere.
LUWG Consensus Recommendation: • 3(c): Update MS4s, Sewer Service Areas, 2025 Population Projections, and 2014 - 2017 Population Estimates • Adjust 2025 population projections for all counties using population estimates. • Postpone any updates to the land use until the summer of 2021 in preparation for the 2021-23 Milestones • Rationale: • New and/or corrected MS4 and Sewer Service Areas were provided by local jurisdictions and visually evaluated against data used previously to verify their improved accuracy. • CBP Partners rely on the latest Census population estimates combined with the latest state-provided population projections as the foundation for the 2025 land use (Current Zoning baseline) and Land Policy BMPs used in CAST. • Translating changes in land cover from either change “hot spots” (2013/14 – 2017/18) or from the National Land Cover Database (2013-2016) into the Phase 6 land uses has revealed a variety of equally-plausible decision rulesets. • Data limitations prevented the development of change “hot spots” in Virginia. • Recently-produced wall-to-wall 1m-resolution changes in tree canopy indicate much different trends compared to those derived from high-resolution change “hot spots” or from the 2001-2016 National Land Cover Database.
“Hot Spot” vs NLCD change (units in acres) • 1. Update high-resolution land cover within Landsat-satellite derived “Hot Spots”: • Excludes Virginia due to issues with 2014 land cover and 2018 NAIP imagery • 2013/14 land cover data updated with 2017 aerial imagery in Maryland • Developed decision rules to relate land cover change to Phase 6 land uses. • 2. Update high-resolution land cover everywhere using 2016 National Land Cover Dataset: • For Virginia only • Update based on change in impervious cover from 2011-2016 and for all other classes from 2013-2016. • Developed decision rules to relate land cover change to Phase 6 land uses. These rules will be reviewed by the LUWG in September. • 3. How does NLCD change (2013-2016) compare to High-res change (2013-2017)? • High-res change: • NLCD change:
Example Land Use Decision Rules (High-res “Hot Spot” change) Impervious Roads (IR): mapped change in “Imperv Roads” + relative developed proportion of increased barren land Imperv.Roads or… Imperv.Roads + Barren * (IR13 / (IR13 + INR13 + TCI13 + TG13 + TCT13)) Impervious Non-Roads (INR): same method as used for IR but with relative proportions of INR Tree Canopy over Impervious (TCI): inferred with co-occurrence of development and forest loss max((Imperv.Roads + Imperv.NonRoads, Barren) * TCI13 / (IR13 + INR13) Turf Grass (TG): assumed to always occur; same method as TCI but using relative proportions of TG Tree Canopy over Turf (TCT): inferred with co-occurrence of development and forest loss; same as TCI but using relative proportions of TCT Forest (FORE): relative fraction of mapped change in “Trees” minus relative fraction of change in TCI and TCT “Trees” * (FORE13 / (FORE13 + WLO13 + WLF13)) – ((TCI17+ TCT17) * (FORE13 / (FORE13 + WLO13 + WLF13)) Wetland, Other (WLO): same method as used for Forest but with relative proportions of WLO Wetland, Floodplain (WLF): same method as used for Forest but with relative proportions of WLF Water (WAT): mapped change in “Water” Mixed Open (MO): if agriculture in county is declining, 2012 – 2017, assign remaining change acres to this class, otherwise apportion remaining change using relative herbaceous fraction, e.g., RemainingChange * MO13 / (MO13 + CRP13 + PAS13) Cropland (CRP): if agriculture in county is declining, 2012 – 2017, set to zero, otherwise apportion remaining change using relative herbaceous fraction, e.g., RemainingChange * CRP13 / (MO13 + CRP13 + PAS13) Pasture (PAS): same method as used for Cropland but with relative proportions of PAS
Tree Canopy over Impervious Change 2014 – 2018 Prince George’s County
Tree Canopy over Impervious Change 2014 – 2018 Prince George’s County
Comparison of NLCD, HotSpot, and Wall-To-Wall Estimates of Tree Canopy Change (2013/14 – 2016/18) NLCD “Forest” classifications: 5-class: Deciduous, Evergreen, Mixed, Woody Wetlands, Shrub/scrub 4-class: Deciduous, Evergreen, Mixed, Woody Wetlands 3-class: Deciduous, Evergreen, Mixed To compare 30m NLCD-based assessments of tree canopy change with 1m assessments, three different classifications of tree canopy are presented for consideration. Tree canopy is present in all three forest classes (41-43) and the woody wetland class (90), although the latter is sometimes omitted in estimates of forest cover. Shrub/scrub (52) typically represents mid-successional forest and may or may not be mapped as tree canopy at high-resolution. These data indicate that there are substantial differences in estimates of tree canopy change between the NLCD, Hot-Spots, and Wall-to-Wall mapping approaches. This is because the average size of tree canopy change patches is much smaller than the 900m2 size of a Landsat E-TM cell used to create the NLCD and to identify hot spots (within which change at 1m-resolution was mapped). Agreement between change detected in the NLCD and from high-resolution imagery is dependent on the average size of change patches and consistency between the image dates and temporal range represented by both products. See LUWG_MilestoneUpdate2019_v3.xlsx
Tree Canopy Change, Prince George’s County, Maryland: 2014 – 2018 Wall-to-Wall Data • TC Loss: • 59% of loss change occurred within forest or wetlands • 41% of loss occurred in developed areas • TC Gain: • 16% of gain occurred within forest or wetlands • shrub/scrub; edge of forest • 54% of gain occurred in developed areas • 29% of gain occurred on agricultural lands TC Change (acres) TC Change Patch Size Statistics High-Res (m2) TC Change Patch Size Statistics NLCD (m2)
Tree Canopy Change, Anne Arundel County, Maryland: 2014 – 2018 Wall-to-Wall Data • TC Loss: • 57% of loss change occurred within forest or wetlands • 42% of loss occurred in developed areas • TC Gain: • 9% of gain occurred within forest or wetlands • shrub/scrub; edge of forest • 55% of gain occurred in developed areas • 35% of gain occurred on agricultural lands TC Change (acres) TC Change Patch Size Statistics High-Res (m2) TC Change Patch Size Statistics NLCD (m2)
Milestone vs Phase III WIP Land Use Change (acres in CBW) • Data in black is from the draft 2019 Milestone Land Use and represent change in acres from 2013 – 2025 (LUWG recommended not using these data). • Data in red is from the Phase III WIP Land Use developed for the 2017 mid-point assessment and represent change in acres from 2013 – 2025.