Download
1 / 20
200 likes | 205 Views
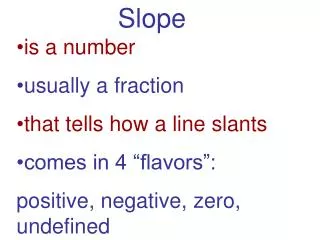
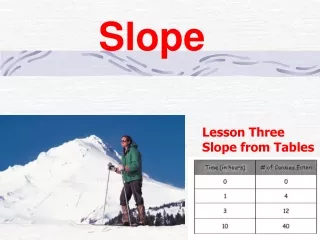
Slope. Objectives. Determine whether a function is linear. Graph a linear function given a point and a slope. Meteorologists begin tracking a hurricane's distance from land when it is 350 miles off the coast of Florida and moving steadily inland.

E N D
Objectives Determine whether a function is linear. Graph a linear function given a point and a slope.
Meteorologists begin tracking a hurricane's distance from land when it is 350 miles off the coast of Florida and moving steadily inland. The meteorologists are interested in the rate at which the hurricane is approaching land.
+1 +1 +1 +1 –25 –25 –25 –25 This rate can be expressed as . Notice that the rate of change is constant. The hurricane moves 25 miles closer each hour.
Functions with a constant rate of change are called linear functions. A linear function can be written in the form f(x) = mx + b, where x is the independent variable and m and b are constants. The graph of a linear function is a straight line made up of all points that satisfy y = f(x).
+2 +2 +2 –1 –1 –1 The rate of change, , is constant . So the data set is linear. Example 1A: Recognizing Linear Functions Determine whether the data set could represent a linear function.
+1 +1 +1 +2 +4 +8 The rate of change, , is not constant. 2 ≠ 4 ≠ 8. So the data set is not linear. Example 1B: Recognizing Linear Functions Determine whether the data set could represent a linear function.
+7 +7 +7 –9 –9 –9 The rate of change, , is constant . So the data set is linear. Check It Out! Example 1A Determine whether the data set could represent a linear function.
–2 –2 –2 –4 –4 –8 The rate of change, , is not constant. . So the data set is not linear. Check It Out! Example 1B Determine whether the data set could represent a linear function.
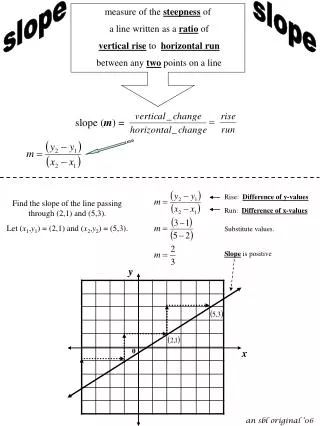
The constant rate of change for a linear function is its slope. The slope of a linear function is the ratio , or . The slope of a line is the same between any two points on the line. You can graph lines by using the slope and a point.
Graph the line with slope that passes through (–1, –3). Example 2A: Graphing Lines Using Slope and a Point Plot the point (–1, –3). The slope indicates a rise of 5 and a run of 2. Move up 5 and right 2 to find another point. Then draw a line through the points.
The negative slope can be viewed as Example 2B: Graphing Lines Using Slope and a Point Graph the line with slope that passes through (0, 2). Plot the point (0, 2). You can move down 3 units and right 4 units, or move up 3 units and left 4 units.
Graph the line with slope that passes through (3, 1). Check It Out! Example 2 Plot the point (3, 1). The slope indicates a rise of 4 and a run of 3. Move up 4 and right 3 to find another point. Then draw a line through the points.
The slope of a vertical line is undefined. The slope of a horizontal line is zero.
Example 5: Graphing Vertical and Horizontal Lines Determine if each line is vertical or horizontal. A. x = 2 This is a vertical line located at the x-value 2. (Note that it is not a function.) x = 2 y = –4 B.y = –4 This is a horizontal line located at the y-value –4.
Check It Out! Example 5 Determine if each line is vertical or horizontal. A. y = –5 This is a horizontal line located at the y-value –5. x = 0.5 y = –5 B.x = 0.5 This is a vertical line located at the x-value 0.5.
The slope is . Example 6: Application A ski lift carries skiers from an altitude of 1800 feet to an altitude of 3000 feet over a horizontal distance of 2000 feet. Find the average slope of this part of the mountain. Graph the elevation against the distance. Step 2 Graph the line. Step 1 Find the slope. The y-intercept is the original altitude, 1800 ft. Use (0, 1800) and (2000, 3000) as two points on the line. Select a scale for each axis that will fit the data, and graph the function. The rise is 3000 – 1800, or 1200 ft. The run is 2000 ft.
Check It Out! Example 6 A truck driver is at mile marker 624 on Interstate 10. After 3 hours, the driver reaches mile marker 432. Find his average speed. Graph his location on I-10 in terms of mile markers. Step 1 Find the average speed. Step 2 Graph the line. The y-intercept is the distance traveled at 0 hours, 0 ft. Use (0, 0) and (3, 192) as two points on the line. Select a scale for each axis that will fit the data, and graph the function. distance = rate time 192 mi = rate 3 h The slope is 64 mi/h.
Lesson Quiz: Part 1 1. Determine whether the data could represent a linear function. yes 2. For 3x – 4y = 24, find the intercepts, write in slope- intercept form, and graph. x-intercept: 8; y-intercept: –6; y = 0.75x – 6