Download
1 / 17
180 likes | 315 Views
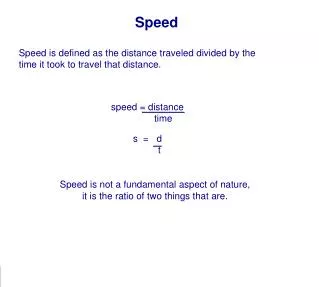
SPEED. Speed. Speed is the distance an object moves in a particular amount of time. OR How far you go and how long it takes to get there. How to find the speed of an object or a person:. Calculate Speed. Distance /Time (distance divided by time) Try some: calculate the speed. Answers.

E N D
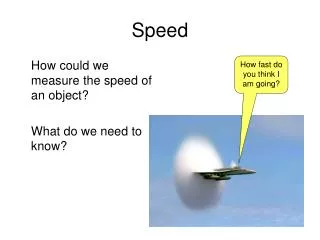
Speed • Speed is the distance an object moves in a particular amount of time. OR • How far you go and how long it takes to get there.
Calculate Speed • Distance /Time (distance divided by time) • Try some: calculate the speed
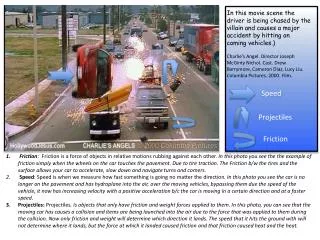
Average Speed • Most objects do not move at constant speeds for very long. • Race cars change speeds many times during the race: slower around the curves and faster on the straight places.
Graphing Motion You can show the motion of an object on a line graph. Time is on the X-axis (horizontal) and distance is on the Y-axis (vertical). The 2 numbers are called coordinates of the point. Moving Man: http://www.mste.uiuc.edu/Murphy/MovingMan/MovingMan.html
Graphing Constant Motion • Constant motion is motion that does not change. • That means the object is neither speeding up or slowing down. • Constant motion is shown as a straight line on a graph:
Constant Motion Graph • This graph shows constant motion because the slope of the line does not change. • The slope of the line can be used to determine the speed of the object. • The change in distance for every minute on this graph is constant. • Speed = distance time • In this graph Speed = 2 m/min.
Constant Motion continued • This graph also shows constant motion because the slope of the line does not change. • The slope of this line does not change either. • The distance on this graph stays the same. • Speed = d/t = 0/10 = 0 m/min • So what can be said about the motion? • The object is not moving.
Change in Motion • When looking at a graph, you can tell when motion changes because line is not straight. • Change in motion can be seen as a change in the straight line or as a curved line.
Change in Motion continued • In this graph, there are three different types of constant motion. • Motion is constant between minutes 0 and 4, 4 and 6, and 6 and 10. • Even though between these points motion is constant, the overall motion changes.
Change in Motion continued • In this graph, the motion is not constant between any two points. • Motion is constantly changing. • The curve of this graph shows acceleration. • Acceleration is the increase or decrease in speed. • This graph shows increasing speed because the curve goes upward.
Change in Direction • On a motion graph, you can tell when the object reverses direction because the distance from the starting point becomes less. • By looking at the slopes of the two lines, what can be said about the speed before compared to the speed after turning around? • The speed before turning around is quicker because the _______ is greater than after turning around. Slope
Line graphs can show all kinds of information. • Look at the axis labels before you analyze the information.
Analysis: Time Graph • This is a graph showing time for 2 runners in the 600 m race. It shows that George ran 2.5 minutes for the first lap, 3 minutes for the 2nd lap, 3.5 minutes for the 3rd lap, and 3 minutes for the 4th lap. Nina ran 3 minutes for the 1st, 3.5 for the 2nd, 3 for the 3rd, and 2.5 for the 4th. To calculate the average speed, take the total distance and divide by the total time. • George’s average speed: 50 m/min • Nina’s average speed: 50 m/min