Download
1 / 27
310 likes | 565 Views
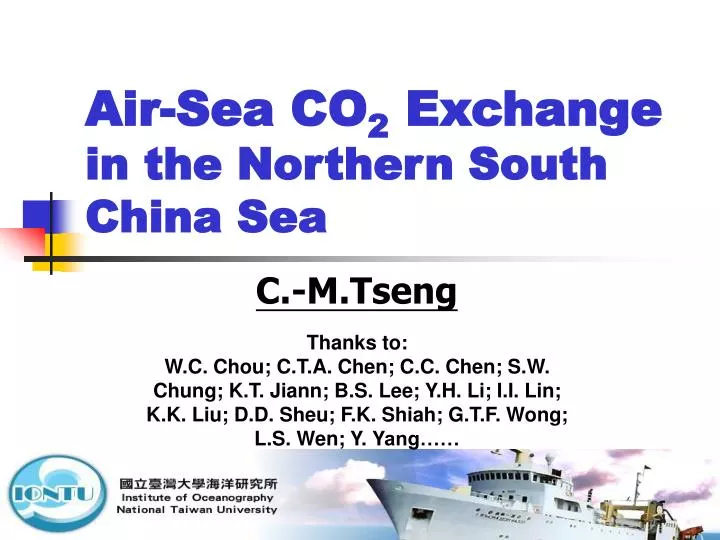
Air-Sea CO 2 Exchange in the Northern South China Sea. C.-M.Tseng. Thanks to: W.C. Chou ; C.T.A. Chen; C . C . Chen; S . W . Chung; K . T . Jiann; B . S . Lee; Y . H . Li; I.I. Lin; K.K. Liu ; D.D. Sheu ; F . K . Shiah; G.T.F. Wong ; L . S . Wen; Y . Y ang……. Talk outline.

E N D
Air-Sea CO2 Exchangein the Northern South China Sea C.-M.Tseng Thanks to: W.C. Chou;C.T.A. Chen; C.C. Chen; S.W. Chung; K.T. Jiann; B.S. Lee; Y.H. Li; I.I. Lin;K.K. Liu;D.D. Sheu; F.K. Shiah; G.T.F. Wong;L.S. Wen; Y. Yang……
Talk outline • Introduction & Overview • Annual & inter-annual variability of Ocean CO2 • Physical and biogeochemical processes affecting variability • Magnitude and variability of Air-sea exchange CO2 flux relative to global scales • Increasing magnitudes of TCO2 and fCO2 • Future study (e.g., El-Niño, Typhoon)
key indicators of global change Sea level • Atmo. CO2, • Temp., • Sea ice. • Sea level Atmo. CO2 Temp. Sea ice.
[CO2] year ppm y-1 2000 1.24 2001 1.85 2002 2.39 2003 2.21 2004 1.61 2005 2.41 2006 1.79 2007 2.17 2008 2.28 1850 1870 1890 1910 1930 1950 1970 1990 2010 • 1970 – 1979: 1.3 ppm y-1 1980 – 1989: 1.6 ppm y1 • 1990 – 1999: 1.5 ppm y-1 • 2000 - 2008: 2.0 ppm y-1 • 2008: 2.3 ppm y-1 Atmospheric CO2 Concentration Year 2008 Atmospheric CO2 concentration: 385 ppm 38% above pre-industrial NOAA 2007; Canadell et al. 2007, PNAS
4.2 Pg y-1 Atmosphere 46% 2.6 Pg y-1 + Land 29% 7.5 Pg C y-1 2.3 Pg y-1 Oceans 26% Fate of Anthropogenic CO2 Emissions (2000-2007) 1.5 Pg C y-1 Canadell et al. 2007, PNAS; Global Carbon Project 2008, update
Mean Annual Air-Sea CO2 Flux Takahashi et al. (2002)
J TS H RR LS PS A1 P C MS PR R KS Environmental Forcing Physical • Seasonal circulation • Kuroshio intrusion • Coastal diluted waters • Internal tides/waves • Upwelling Atmospheric • Winter and summer monsoons • Typhoons • Asian dusts • ENSO events • Climate variability (Shaw & Chao, 1994; Shaw et al., 1996)
Distinctives of the South China Sea • Most of the sea is oligotrophic • Mixed-layer T is high (>22 oC) year round • Well stratified over the year (i.e., Effect of convective overturn is small) • Shallow thermocline (<40 m) • Higher atmospheric dust inputs and Fe fluxes • Seasonally alternative monsoons • Frequent occurrence of typhoons and tropical depressions (over 10 events/year)
Annual Mean SST and SSS SST SSS Liu et. al 2009
Composite Chl-a Distribution Summer (August) Winter (January) SEATS special issue, 2007
Wind SST MLD TND EPZ SRP N+N S-chl I-chl IPP • Seasonal variations in wind speed – Higher in Winter; Lower in Summer (Monsoon) • Variations in T – never drops below 22oC. • Seasonal variations in mixed layer depth - <40 m in most of the year; approach 100 m in Winter. • Variations in nutrients – higher SRP, N+N in Winter • Higher wind speed correlates with lower T and higher Chl-a • Higher biomass and primary production in the Winter accompanies the higher nutrient concentrations. Tseng et. al 2005; 2007; 2009
Air/sea gas exchange Air/sea gas exchange ΔF - - - + + + - - - + + + Photosyn Photosyn . . Δ B Temp. effect Δ Remineral Remineral . . T - - - + + + + + + + Δ Δ Δ Δ D E Mixing/upwelling Mixing/upwelling Factors affect the oceanic CO2 variability in the MLD Surface Mixed-Layer fCO2 Δ Δ C MLD ΔC = (ΔD +ΔE) + ΔF +ΔB +ΔT
Estimating Air-Sea Exchange Fluxes of CO2 F = K DfCO2 = k s (fCO2sw- fCO2air) • Uncertainty:k- affected by wind, air bubble entrainment, sea surface conditions etc. Factors influencing CO2 flux estimates
Zhai' paper: fCO2 in northern SCS Summer Fall Spring (Zhai et al., 2005)
Chen' paper: • OR-I 508 • Nov 15-24 1997 • OR-I 546 • April 7-20 1999 • 15~28 stations • Wet season (sea-to-air): • ~0.006 Gt C per yr • Dry season (air-to-sea): • ~0.004 Gt C per yr (Chen et al., 2006) fCO2 in northern SCS
fCO2=8.8 x T + 123.0; (or fCO2=184.9 x e0.025) r2= 0.81 SEATS: Mixed-layer fCO2 Temperature Effect fCO2 • Water fCO2 varies directly with T and inversely with chl-a – Low fCO2 in Winter (Solubility+Biological pump). • fCO2 water <fCO2 air in Winter -> invasion; fCO2 water >fCO2 air in Summer-> evasion Temp.
Jun July Aug May Sept Oct Mar Nov Nov-Dec Dec Jan Feb-Mar
Conceptual diagram of the contributing processes to the changes in salinity, temperature and the carbonate system in the mixed layer Tseng et al., 2007
Comparison with Other Time-series Stations The relative importance of temp. & biological effect on seasonal fCO2 variability (Takahashi et al., 2002, DSRII) Location and Oceanic regime Temperature effect / Biological effect Temperature effect - Biological effect References 18º15’N , 115º35’E South China Sea,the largest subtropical marginal sea 2.0 (80/40 matm) +40 mtam SEATS This study 22º45’N, 158ºW North Pacific subtropical gyre 2.6 (59/23 matm) Calculated based on Winn et al. (1994) HOT +36 mtam 31º50’N, 64º10’W Western North Atlantic subtropical gyre Bates et al. (2001) Takahashi et al. (2002) BATS 2.7 (150/55 matm) +95 mtam 44ºN, 155ºE Northwestern subarctic Pacific Ocean Calculated based on Tsurushima et al. (2002) 0.8 (174/228 matm) -54 mtam KNOT Wong and Chan (1991) Takahashi et al. (2002) 50ºN, 145ºW Northeastern subarctic Pacific Ocean 0.9 (100/115 matm) -10 mtam OSP
SEATS CO2 Flux (1999~2004) Seasons Fluxes (mol C m-2 y-1) Net ≈ -0.02 (Tseng et al., 2007) “+” denotes evasion to the atmosphere “-” denotes invasion to the ocean Months
SEATS CO2 Flux (1999~2007) • Normally CO2 invasion in Winter ;CO2 evasion in Summer • CO2flux varies inter-annuallymarked in red dashed circle • Interannual anomaly may be linked to large-scale climate variability (e.g, ENSO, Pacific Decadal Oscillation etc.) Net evasion flux: + 0.1 ± 0.7
Comparison with other time-series stations Annual sea-to-air flux References (molC m-2year-1) + 0.1 ± 0.7 This study SEATS (1999-2004) Tseng et al., 2007 -0.02 ± 1.06 SEATS (2002-2003) Chou et al. 2004 -0.1 to –0.2 SEATS (1990-2004) Chai et al., 2009 - 0.04 +0.33 Chai et al., 2009 Whole SCS -0.7 Winn et al., 1994 HOT BATS -0.3 to –0.8 Bates et al., 1996, 1998
Interannual Trends of CO2 at SEATS NTCO2=(2.0 ± 1.4)X+ 1886.1; r2= 0.11, p=0.17 2004 1999 2000 2001 2002 2003 NfCO2=(2.6 ± 0.9)X+ 358.3; r2= 0.05, p<0.01 r2= 0.84 1999 2000 2001 2002 2003 2004 An increase of M-L fCO2 &NTCO2 Tseng et al., 2007
Modeled Surface fCO2 Distributions Feb. May Nov. Aug. Chai et al., 2009 averaged +0.33 moles C m-2 year-1
SCS CO2 Flux (1990~2004) La Niña El Niño Annual means (dash line) Chai et al., 2009
Inter-annual trends of CO2 at SEATS NTCO2 fCO2 Chai et al., 2009
References • Tseng C.-M., George T.F. Wong, I. I. Lin, Chou-Long Wu, KK liu (2005) A unique seasonal pattern in phytoplankton biomass in low-latitude waters in the South China Sea, Geophysical Research Letters, 32, L08608, doi:10.1029/2004GL022111. • Wen-Chen Chou, David D., Sheu, C.T. Arthur Chen, S. L. Wang and C.-M. Tseng (2005) Seasonal variability of carbon chemistry at the SEATS time-series site, northern South China Sea between 2002 and 2003. Terrestrial, Atmospheric and Oceanic Sciences, 16, 445-465. • Tseng C.-M., G.T.F. Wong, W.-C. Chou, B.-S. Lee, D.D. Sheu, K.-K. Liu (2007) Temporal Variations in the carbonate system in the upper layer at the SEATS station. Deep-Sea Research II, 54/14-15: 1448-1468. • Chai F., G. Liu1, H. Xue, L. Shi, Y. Chao, C.-M. Tseng, W.-C. Chou, K.-K. Liu (2009) Seasonal and Interannual Variability of Carbon Cycle in South China Sea: a Three- Dimensional Physical-Biogeochemical Modeling Study, Journal of Oceanography, 65, 703-720. • Liu, k.K., C.-M. Tseng, T.Y. Yeh, L.W. Wang, (2009) Elevated phytoplankton biomass in marginal seas in the low latitude ocean: A case study of the South China Sea, Advances in Geosciences (in press). • Tseng, C.-M., G.-C. Gong, L.-W. Wang, K.-K. Liu, and Y. Yang (2009), Anomalous biogeochemical conditions in the northern South China Sea during the El-Niño events between 1997 and 2003, Geophysical Research Letters, 36, L14611, doi:10.1029/ 2009GL038252. • Tseng, C.-M., K.-K. Liu, L.-W. Wang, and G.-C. Gong (2009), Anomalous hydrographic and biological conditions in the northern South China Sea during the 1997–1998 El Niño and comparisons with the equatorial Pacific. Deep-Sea Research I, doi:10.1016/ j.dsr.2009.09.004. • Liu, K.-K., C.-M. Tseng, C.-R. Wu, I-I Lin (2009) Biogeochemical fluxes of the South China Sea. In: Liu, K.-K., Atkinson, L., Quiñones, R., Talaue-McManus, L. (Eds.) Carbon and Nutrient Fluxes in Continental Margins: a Global Synthesis. IGBP Book Series, Springer, Berlin. Pp. 464-482.