1 / 7
70 likes | 74 Views
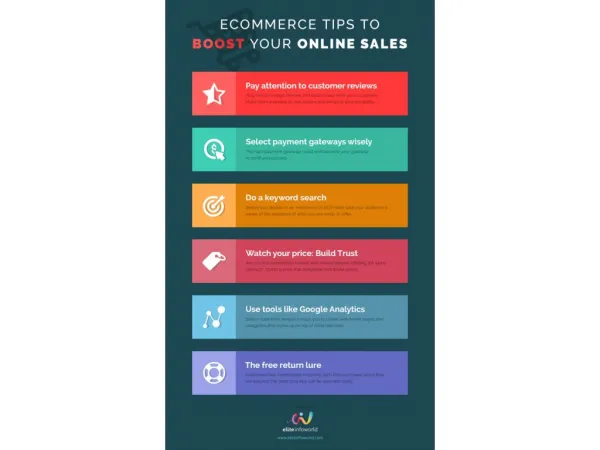
Before we understand the uses of infographics letu2019s look at the definition of infographics and advantages of using it. Infographics are just the graphical representation of data or information that are used to present a particular information quickly and clearly before readers. The main advantage of using infographics in a web content is that it presents even complicated information in a simple way that makes the readers understand it at first sight. Read more on https://bit.ly/31ObiNv

E N D
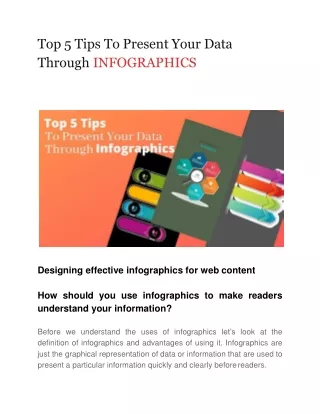
Top 5 Tips To Present Your Data ThroughINFOGRAPHICS Designing effective infographics for web content How should you use infographics to make readers understand your information? Before we understand the uses of infographics let’s look at the definition of infographics and advantages of using it. Infographics are just the graphical representation of data or information that are used to present a particular information quickly and clearly before readers.
The main advantage of using infographics in a web content is that it presents even complicated information in a simple way that makes the readers understand it at first sight. It is important for every website owner to use infographics in such a way that it helps people in understanding even the most complex information quickly without using any words. Using infographics you can see trends, collect insights and deeply understand the subject matter content. While creating infographics you should pay more attention to the data instead of its aesthetic appeal. It is also important to avoid the use of different elements while making the infographic more attractive as it might distract the attention of the viewers. When infographics are designed to convey clear information, the viewers understand it thoroughly and are able to know the subject matter quickly and clearly. If you browse the internet in order to find the top web design and marketing company in Los Angeles, you will notice SFWPExperts among other names. In addition to designing beautiful and effective websites our team also helps out entrepreneurs in making their web content more engaging and attractive using infographics. You can connect with us through phones, chats and emails to share your website needs with us and we will provide you the solutions as fast as we can. Now we are going to share with you top 5 tips to present your data through infographics that will make your data look more interesting: 1. Maintain Simplicity
Design data in a simple way so that it is easy to understand for the viewers. By this you should not assume that if the data is presented in a minimalistic way it won’t look beautiful as compared to an attractive approach. There have been a lot of examples where data has been presented in a simple and effective manner and it has drawn the attention of most of the viewers. 2. Present Data Clearly While designing your infographics you need to make sure that it conveys the information in a very clear and understandable manner. Remember that effective infographics tend to grab more viewer’s attention instead of the fancy infographics. While designing the infographics for your content make sure that all the elements are eliminated that might distract the attention of viewers. It is very important for the viewers to understand your information that is being conveyed through infographics. Pay attention to every element of your infographic including color, shape, layout, typography, etc. as it will determine if the viewers have understood your information well or not. In case you need any help with designing your infographics or even your website you can get in contact with our web design Los Angeles company. We believe that no other company around the world would be able to match our great services at the prices we offer. This is because we aim to delight the customers with our quality services so that they keep coming back to us to meet their every small and big website needs.
3. Convey Relevant Information Not Just Fancy Illustrations One misconception that many people have about infographics is that its data should be broken down into small chunks to make it more interesting. But the reality is something different as people are more likely to be interested in your information if the story itself is interesting and not because of just fancy illustrations. Keep in mind that poor copy or misleading statistics can never be covered up by using good infographics in your content. It is important for you to convey relevant information through your infographics so that viewers can understand it and find useful for them. Designing effective infographics requires the combined effort of graphics designer and content developers who make sure that all the elements of infographics are looking perfect. However if you want to design some beautiful infographics for your web content you need to have a detailed discussion with our associates. Then our Los Angeles based web design company will be able to offer you some visually appealing infographics. In order to provide our clients with a great customer experience we always strive hard to make a super fast and efficient delivery of projects of any complexity. 4. Use Charts To Present Data Effectively Many website owners think that charts are the boring elements in a web content that don’t add visual appeal to their infographics. But it is not true as you can use a bar chart to convey the information in a simple and effective manner. It can also help you in breaking down the complex information into a simple form so that it can be understood by
your target audience. Besides this you can also use colors to show similarities and differences that will make it easier for viewers to understand the information and draw a conclusion from it. It is quite helpful for viewers to understand the information as compared to presenting the data in a tabular format. Not every company is very much concerned about resolving the problem of its customers unless it is a web design and development project. In that case you can rely on our web design company in Los Angeles that offers all kinds of services related to web design. No matter if you want to have a visually appealing landing page, effective infographics or engaging content, we have got you covered. 5. Make Information Easy To Access For Viewers When you use website design elements for creating an infographic give priority to elements that makes your information easily accessible for the viewers. It may happen that the elements you use for your infographics might not be looking fancy or cool but you are sure that viewers will understand the information just by looking at it. Often the designers are requested by clients to make their infographics look cool and interesting but very few people ask them to make infographics simple and easy to understand for viewers. This is because they think that fancy infographics tend to attract more viewers than the simple ones. Creating cool infographics might look as the best way to draw attention of viewers but remember what is most important is the information that you present. By working on your infographics to make it more attractive you risk turning it into just a
design element that is known for its unique design and not the information it offers. You may find many good companies online that create effective infographics but if you want to work with a company that guarantees their work will achieve results, choose SFWP Experts. Our Wordpress website design company has some brilliant designers and developers who deal with almost all the requirements of a website. You can trust us with your project if you are interested in our quality services including responsive web design and development, WordPress website development, E-commerce marketing, search engine optimization etc. Contact Details: 213-277-9177 la@sfwpexperts.com Visit Reference Profile Websites: http://bit.ly/2UMSzQU http://bit.ly/2w8xRAw http://bit.ly/2Oaq5MJ https://do.co/35U0rTd store development, online
http://bit.ly/2OPMUWy http://bit.ly/2Nr3mM1 http://bit.ly/2SF6eqh http://bit.ly/2w6l1CN http://bit.ly/2sgm5Tb http://bit.ly/2HfO49z http://bit.ly/2ZKv9vK http://bit.ly/38pIoFL http://bit.ly/2URvNqO http://bit.ly/37hzWH9 https://ibm.co/36ugdUl