Download
1 / 42
440 likes | 884 Views
Materials. Aim; To give examples of different materials and describe their properties. Task Make a list of; a) Materials b) Words used to describe a material’s properties. Learning Objectives. ALL will (Grade D)

E N D
Materials Aim; To give examples of different materials and describe their properties. Task • Make a list of; a) Materials b) Words used to describe a material’s properties
Learning Objectives • ALL will (Grade D) • name the different categories of materials and give examples • define keywords • MOST will (Grade C/B) • explain what properties each category of material has • separate materials into natural and synthetic • SOME will make connections between what the material is used for and it’s properties (Grade A/A*)
Keywords To Do; Find out what each keyword means • Brittle • Ductile • Malleable • Hard • Stiff • Tough
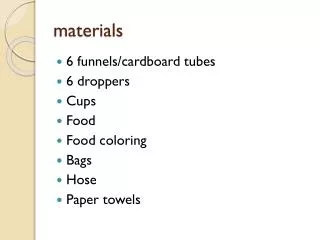
Types of Materials • Metals • Glasses • Ceramics • Polymers • Composites • To Do; • Research each category. Find out; • Examples of materials that fit into the category • What properties the materials in the category have • Whether the material is natural or synthetic • Any information you think may be useful
Extension Work • Using what you have learned, decide which group of materials should be used for each item and explain your choice. • Bike frame • Surfboard • Baking tray • Shopping bag • Dentures
Useful Websites http://ceramics.org/learn-about-ceramics/structure-and-properties-of-ceramics http://www.keytometals.com/page.aspx?ID=MetalProperties&LN=EN# http://www.technologystudent.com/designpro/metals1.htm http://www.lenntech.com/glass.htm http://glasstalks.com/2011/03/16/physicalproperties/ http://www.pslc.ws/macrog/mech.htm http://www.science.org.au/nova/059/059key.html http://www.astarmathsandphysics.com/a_level_physics_notes/materials/a_level_physics_notes_differences_between_malleable_ductile_tough_hard_strong_and_brittle.html
Testing Materials Aim; To carry out different tests on a range of materials Task • What are the different categories of material? • Define the following keywords; a) Brittle b) Ductile c) Malleable d) Hard e) Stiff f) Tough
Learning Objectives • ALL will complete the experiments and tabulate their results (Grade C) • MOST will compare and contrast their results from different materials (Grade B) • SOME will use their results to assess the properties of the materials (Grade A/A*)
Experiments Activity 10E Tensile Testing; Getting a feel for materials 1 Activity 20E Compressive Testing; Getting a feel for materials 2 Activity 30E Hardness Testing; Getting a feel for materials 3 Activity 40E Tear Testing; Getting a feel for materials 4 Activity 50E Measuring Density; Getting a feel for materials 5 Carry out the experiments on the different materials and record your results in a table
Write Up • Group the materials you tested using your results. Give reasons for your choices. • Analyse the method you used during your experiment. What are the possible sources of error? How could you reduce these? How could you improve the method? How could you improve, reliability, accuracy and precision?
Extension Read 100T; Introduction to materials selection charts File 5L (Interactive materials selection charts) File 10D (Materials Database) • How can these charts be used? • What do these charts tell us about materials? • Why are they useful/important?
Hooke’s Law Aim; To explain what Hooke’s Law is and use it in calculations Task 1. How can we test the properties of materials?
Learning Objectives • ALL will collect data, state Hooke’s Law and use it in calculations (Grade D/C) • MOST will explain what the graph shows and distinguish between elastic and plastic deformation (Grade B) • SOME will use the idea of spring constant to explain how stiff a spring is (Grade A/A*)
Hooke’s Law Force, F (N) = Spring constant, k (Nm-1) x Extension, Δx (m) • The extension is proportional to stretching force up to the elastic limit
Elastic and Plastic Deformation • BEFORE the elastic limit the spring behaves elastically – it will go back to it’s original shape once the force is removed • AFTER the elastic limit the spring behaves plastically – it has been permanently stretched and will not return to it’s original shape
Experiment • Collect a spring • Measure the length of the spring and record • Add masses to the springs • Calculate the extension and record
To Do • Draw a graph of load (y axis) and extension (x axis) • Label the following points on your graph and explain what they mean • Elastic Limit • Plastic deformation • Elastic deformation 3. Calculate the spring constant (k) of your spring. If you had data for two springs how could you tell which one was stiffer? Explain your answer (Use ideas about Hooke’s Law).
Stress and Strain Aim; To define stress and strain and calculate them. Task • What is Hooke’s Law?
Learning Objectives • ALL will define stress and strain and calculate it (Grade C) • MOST will distinguish between compressive and tensile stress and strain (Grade B) • SOME will use stress and strain to make connections between other properties of the material (Grade A/A*)
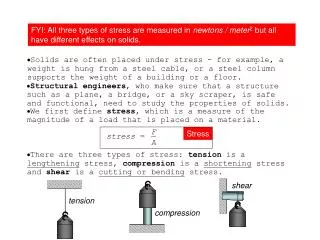
Stress • A measure of how strong a material is. • How much pressure an object can withstand before undergoing physical change • Stress occurs inside the solid Stress, ơ = Force, F (N) ÷ Cross-sectional area, A (m2) • Measured in Nm-2 or Pa
Strain • A measure of how much a material has stretched • Putting pressure (stress) on an object causes it to stretch • A ratio between extension and original length which has no units Strain, ɛ = Extension, Δx (m) ÷ Original Length, L (m)
Compressive Stress and Strain • Compression means to be squashed • Compressive stress causes the object to decrease in length • Compressive strain is negative.
Tensile Stress and Strain • When an object is stretched • Tensile stress causes the object to increase in length • Tensile strain is positive.
Experiment Compressive Stress and Strain Tensile Stress and Strain Use an elastic band Measure the original length Calculate the cross-sectional area Add masses to it Measure the length of the band Record in a table Calculate stress and strain • Make a cylinder with paper • Measure the original length • Calculate the cross-sectional area • Add masses to it • Measure the length of the cylinder • Record in a table • Calculate the stress and the strain
a) Plot a graph for each of your results b) Do paper and elastic bands obey Hooke’s Law? c) What are the limitations of these experiments? d) How could you improve them? 2. a) Compare and contrast the tensile strength of elastic to the compressive strength of paper b) Using your results to assess what other properties paper could have 3. Look at the stress strain graph below. • What properties do these materials have? • What category of materials could they be? ơ ơ ɛ ɛ
Young’s Modulus Aim; To calculate the Young’s Modulus of a material. Task • What is the definition and formula for • Stress b) Strain 2. What is the difference between tensile stress and compressive stress?
Learning Objectives • ALL will complete the experiment, plot a graph and use it to calculate Young’s Modulus (Grade D/C) • MOST will explain what the graph shows in detail and explain why Young’s Modulus is a measure of stiffness (Grade C/B) • SOME will explain the differences between stress strain graphs of ductile and brittle materials (Grade A/A*)
To Do Activity 150E Good Measurements of Stiffness and Strength • Complete the experiment and record your results • Plot a graph of stress (Y axis) against strain (X axis)
Young’s Modulus • A measure of how stiff a material is • Can be found in the elastic region of a stress strain graph Young’s Modulus, E (Nm-2)= Stress, ơ (Nm-2) ÷ Strain, ɛ Stress = F÷A Therefore E = FL ÷ AΔx Strain = Δx÷L
Before the limit of proportionality the material obeys Hooke’s Law and behaves elastically. At the limit of proportionality the graph starts to bend, but the material would return to it’s original shape if the stress was removed. After the limit of proportionality is the elastic limit. At the elastic limit the object begins to behave plastically and would not return to it’s original shape. At the yield point the material begins to stretch without any extra load. The yield point is the stress at which a large amount of plastic deformation occurs.
At the fracture point or breaking stress, the atoms separate completely and the material breaks Ductile Only The ultimate tensile strength/stress is the maximum amount of stress the material can withstand. Necking occurs after this point and cross-sectional area decreases.
Brittle materials do not plastically deform • UTS and Breaking Stress are the same
Plot a Stress (y)/Strain (x) graph and use it to calculate Young’s Modulus of your material • Label your graph OR sketch a diagram of your graph and label the following points and explain what they mean. • Elastic Region b)Limit of Proportionality c) Elastic Limit d) Plastic Region e) Yield Point f) Ultimate Tensile Stress g) Breaking Stress 3. Use diagrams to explain why Young’s Modulus is a measure of stiffness 3. Explain the differences you would see between a stress strain graphs for brittle and ductile materials
4. Explain why a longer wire is better for finding the Young’s Modulus of a material. 5. Find out which materials are • Strong in compression but weak in tension • Strong in tension but weak in compression
Strength and Toughness Aim; To explain how the strength and toughness of a material is calculated. Task • How is Young’s Modulus calculated? • Sketch a stress strain graph for; a) ductile material b) Brittle material
Learning Objectives • ALL will use a graph to calculate the strength and toughness of a material (Grade C) • MOST will explain why the area under a stress strain graph indicates how tough a material is (Grade B) • SOME will derive the equation for energy stored per unit volume using the equations for stress, strain and Young’s Modulus (Grade A/A*)
Strength • The ability of a material to withstand stress • The points at which strength is measured are; • Yield Stress – Point at which plastic deformation begins • Breaking Stress – Point at which the material breaks
Breaking stress looks lower on a stress strain graph because the original cross-sectional area (CSA) is used to calculate strain. As the material is necking CSA is decreasing and stress increases. Complete Q1 – 5 pg 87 Advancing Physics Textbook
Toughness • A measure of how much energy the material can absorb before it breaks. • Energy stored per unit volume can be found by calculating the area under a stress strain graph
Low energy per unit volume = brittle material High energy per unit volume = tough material
Stress = Force ÷ Area Strain = Extension ÷ Original Length Area under graph = Stress x Strain = Force x Extension Area x Original Length = Work Done Jm-3 Volume Work done = Energy stored = Force x Distance
To Do • Calculate the energy stored per unit volume for the piece of wire you plotted a stress strain graph for • Complete Q6a) – c) on the print out pg 324 Advanced Physics 4U