Download
1 / 13
130 likes | 226 Views
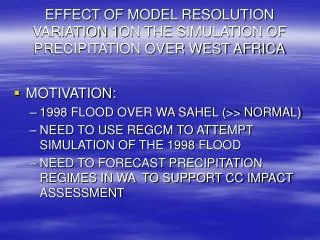
The Effect of ENSO on Precipitation in Atlanta. Steven DiNapoli EAS 4803 YW April 22, 2008. Introduction. Current Atlanta Drought Projected to continue due to La Niña conditions Many previous droughts were exacerbated by La Niña (e.g. 1950s, 2000)

E N D
The Effect of ENSO on Precipitation in Atlanta Steven DiNapoli EAS 4803 YW April 22, 2008
Introduction • Current Atlanta Drought • Projected to continue due to La Niña conditions • Many previous droughts were exacerbated by La Niña (e.g. 1950s, 2000) • Objective of Analysis – Analyze relationship between ENSO and precipitation in Atlanta • Performed correlations on historical ENSO data and monthly precipitation in Atlanta • Hartsfield-Jackson International Airport
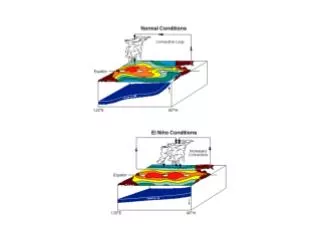
ENSO Data • ONI – Oceanic Niño Index • Measure of 3-month running mean SST anomalies in the Eastern Pacific • Positive Values correspond to El Niño conditions
Atlanta Precipitation • Hartsfield-Jackson International Airport • Monthly totals from NCDC • Much more variability than ONI data • Numerous outlier points
Correlating the Data (Attempt #1) [r1, p1] = corrcoef(oni, precip);
Problems with Attempt #1 • Too much noise in precipitation data • Affected by outside influences (e.g. hurricanes) • Outlier data points • Correlation Coefficient = 0.0690 • Explains less than 0.5% of precipitation variance • p-Value = 0.0687 • Correlation is statistically insignificant • p-value should be less than 0.05 • Need to filter noise out of precipitation data • 3-month running mean precipitation • ONI values are derived from a 3-month running mean
Problems with Attempt #2 • Precipitation data still very noisy • Correlation Coefficient = 0.1069 • Still very weak; explains ~1% of the variance • p-value = 0.0048 • Correlation is significant • More filtering still needed • Next attempt correlates average ONI index for each year with total yearly precipitation
Analysis of Attempt #3 • Much less noise in the data • Outlier points removed • Correlation coefficient = 0.2462 • Still weak, but much stronger than before • p-value = 0.0625 • Significance lost due to lack of data points (58 vs. 696) * Would regional precipitation totals provide a better dataset to correlate with ENSO?
Conclusion • All major droughts occurred during La Niña • Not all La Niña events lead to drought • The opposite is not always true for El Niño • Correlations were very weak • Data was very noisy • Long-wave synoptic patterns • Hurricanes & convective thunderstorms • La Nina conditions → More hurricanes • Numerous other forcings ignored (e.g. NAO) • Only one station considered