Download
1 / 100
1.02k likes | 1.16k Views
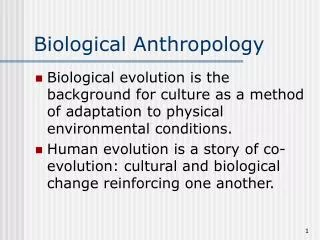
Indirect relationships in complex biological networks Ferenc Jordán The Microsoft Research – University of Trento , Centre for Computational and Systems Biology , Italy jordan.ferenc @ gmail.com www.colbud.hu / fjordan. Overview Systems thinking in biology The network perspective

E N D
Indirect relationships in complex biological networks Ferenc Jordán The Microsoft Research – University of Trento, Centre forComputational and Systems Biology, Italy jordan.ferenc@gmail.comwww.colbud.hu/fjordan
Overview • Systems thinkinginbiology • The networkperspective • Noveltoolsinnetworkanalysis • Topology and dynamics of biologicalsystems • Software
What is a system in biology? ecosystem organism tissue / organ cell macromolecule
Hierarchy and embedded nature of biological systems more than a set co-evolvedentities mutualdependence, interactions
Hierarchy and embedded nature of biological systems from green to red is bottom-up from blue to red is top-down
Hierarchy of novelties succession broodcare germline phagocytosis
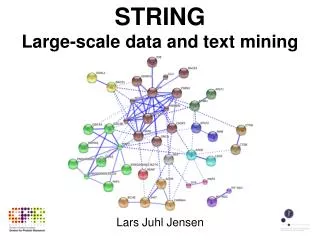
How to look at the system? Case study #1:topology of metabolism. Zhu D and Qin ZS. 2005. Structural comparison of metabolic networks in selected single cell organisms. BMC Bioinformatics, 6:8.
How to look at the system? Case study #2: the tensegrity cell model rigid and elastic parts of the cytoskeleton Ingber, D.E. et. al.1997. Cellular Tensegrity and Mechanochemical Transduction. Annual Reviews of Physiology, 19:329-339
How to look at the system? Case study #3: evolution of development. Diodon Orthagoriscus Geometric transformation: one parameter switches between two species Evolution has changed only a single parameter? D`Arcy Thompson: On Growth and Form, 1917
Systemsbiology… …as a discipline: integrativestudy of severalbiologicaldisciplines, withthehope of synthesis. Interactionsbetweencomponentswithin and between subsystems. …as a paradigm: quantitativeholisticthinking, everything is connectedto everything else, yes, but exactly how and to whatextent? Howstructurepredictsdynamics? ….asa methodology: database management, powerfulcomputational tools, languages, algorithms generating structures and dynamics, concurrency.
Problems: - Managing complexity - Predicting systems dynamics - Vulnerability vs robustness - More development in diverse fields of biology / requisite for integration Challenges: - Drug design, predictivemedicine - System-based conservation - Systems view in humanities?
1-species system: systemsviewonpopulationbiology - collective motion - fish shoaling - bird flocking - densitydependence - social network / group dynamics
3-species system: positive feedback and coexistence zooplankton Prevalence of Utricularia in oligotrophic environments + + + periphyton Utricularia Ulanowicz, R.E. 1990. Aristoteliancausalitiesinecosystemdevelopment. Oikos, 57:42-48.
4-species system: causes, pathways, mechanisms ants rodents + + + - small-seeded plant large-seeded plant
Most frequent, empirically-definedmodulesinfoodwebs Menge, B.A. 1995. EcologicalMonographs, 65:21-74.
Molecularnetworkmotifs/modules A B C A C B D E
Comparingmotifsindifferentnetworks Milo, R. et al. 2002. Science, 298: 824-827.
n-speciessystem: indirecteffectsincomplexfoodwebs human seal - - + fish
n-speciessystem: indirecteffectsincomplexfoodwebs human seal + - + fish - +
n-speciessystem: indirecteffectsincomplexfoodwebs Benguela ecosystem enumeratingpathways determiningtheirsign estimatingtheirstrength predictions… # of <9 steps indirect pathways from seal tohake: 28.722.675 Yodzis, P. 2001. Must top predators be culledforthesake of fisheries? TrendsinEcology and Evolution, 16:78-84.
Systems thinking in ecology: early abstractions Summerhayes, V.S. and Elton, C. 1923. Contributions to the ecology of Spitsbergen and Bear Island. Journal of Ecology, 11:214-268.
Modern databases Martinez, N.D. 1991. Artifactsorattributes? Effects of resolutiononthe Little Rock Lake food web. EcologicalMonographs, 61:367-392.
Steps of networkanalysis 1. Network datacollection 2. Network construction 3. Network analysis
Steps of network analysis 0. Determinewhethertheproblem is a network-problem 1. Network data collection 2. Network construction 3. Network analysis 4. Testing predictions
Graph theory – some basics Graph: node set V(G), link set E(G), relation Directed: ordered pair of nodes (digraph) Weighted: numberassignedtoeach link Signedgraph: eachedge is of either + or - sign Component: connectedsubgraph Completegraph: allnodesareneighbours Regulargraph: allnodeshavethesame D(i) Bipartite: nodes in 2 subsets + + - - +
Degree: the most local view In a flow network: Source: D(in)=0 Sink: D(out)=0 density degreedistribution degree = in-degree + out-degree
Degree: the most local view In a flow network: Source: D(in)=0 Sink: D(out)=0 L/M*N bipartite density degreedistribution degree = in-degree + out-degree
Clusteringcoefficient i = 4/12 links of node i linksbetweentheneighbours of node i non-existing
Distance: length of shortestpath i and j are not reachable: dij = ∞ i j dijvaluesinD dij-1valuesinR distancematrix reciprocaldistancematrix averagedistance
0,4 density 2 degree distribution distance / diameter aggregation centrality subgraph Jordán, F. 2009. Phil. Trans. Roy. Soc. London B, 1733-1743.
High-centrality nodes social stars alpha animals keystone species traffic hubs keymetabolites Structural and dynamical importance? How to destroy, how to assemble a system?
Flow reliability Flow networks: N=5 L=5 1 sink
Flow reliability Flow networks: N=5 L=5 1 sink 25 possibilities p, q=(1-p) F dependsontopology Jordán, F. and Molnár, I. 1999. Reliable flows and preferred patterns in food webs. Evolutionary Ecology Research, 1:591-609.
Positionsinspanningtrees Ai: subordinates + 1 Ci: ∑Asub + Ai Garlaschelli et al. 2003. Nature, 423:165-168.
Centrality measures:status - contrastatus = net status positionsinhierarchies 9-0=9 1 4-1=3 1 1 1 2 1 2 s = summeddistance: ∑dixforall i s’ is thesameafterreversingthesigns 2 3 Harary, F. 1961. GeneralSystems 6: 41-44.
TI (WI)-index C PBA * PCB + PDA * PCD = PCA C C PCD = 1/DC PCD PCB PCB D D B PBA PDA B PBA PBA * PCB = PCA A A Jordán, F., Liu, W.-C. and van Veen, F.J.F. 2003. CommunityEcology, 4:79-88.