Download
1 / 2
20 likes | 149 Views
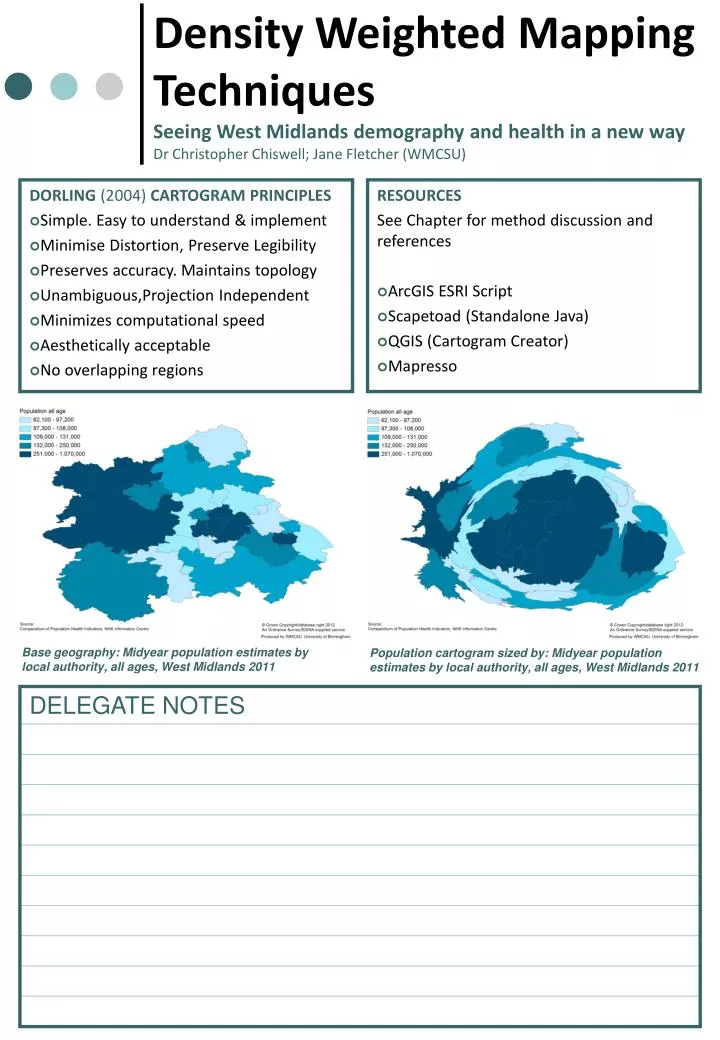
Density Weighted Mapping Techniques Seeing West Midlands demography and health in a new way Dr Christopher Chiswell; Jane Fletcher (WMCSU). DELEGATE NOTES. DORLING (2004) CARTOGRAM PRINCIPLES Simple. Easy to understand & implement Minimise Distortion, Preserve Legibility

E N D
Density Weighted Mapping Techniques Seeing West Midlands demography and health in a new way Dr Christopher Chiswell; Jane Fletcher (WMCSU) DELEGATE NOTES DORLING (2004) CARTOGRAM PRINCIPLES • Simple. Easy to understand & implement • Minimise Distortion, Preserve Legibility • Preserves accuracy. Maintains topology • Unambiguous,Projection Independent • Minimizes computational speed • Aesthetically acceptable • No overlapping regions RESOURCES See Chapter for method discussion and references • ArcGIS ESRI Script • Scapetoad (Standalone Java) • QGIS (Cartogram Creator) • Mapresso Base geography: Midyear population estimates by local authority, all ages, West Midlands 2011 Population cartogram sized by: Midyear population estimates by local authority, all ages, West Midlands 2011
How to Make Area Cartogram Maps in ArcGIS (Dempsey C, GIS Lounge). Walkthrough including common pitfalls, in generating cartograms within ArcGIS. Accessible at: http://www.gislounge.com/how-to-make-area-cartogram-maps-in-arcgis/ Scapetoad (Choros). As well as providing freeware javascript transformation, includes references and links to developing cartogram techniques. Accessible at: http://scapetoad.choros.ch/index.php Indiemaps (Johnson Z). Blog covering variety of techniques and tools for improving data visualisation. Accessible at: http://indiemaps.com/blog/ Improving Visualisation (Dataviz). Commissioned by the Department of Communities and Local Government and carried out by Oxford Consultants for Social Inclusion. Provides diverse examples of data visualisation relevant to the public sector at all levels, including case studies. Accessible at: http://www.improving-visualisation.org/ Geographer At Large (Anon). Blog posts on different mapping techniques, particularly in the context of New York. Quote: “Geography invariably leads to revolution” Accessible at: http://geographer-at-large.blogspot.co.uk/2011_10_01_archive.html Gapminder World (Gapminder Foundation). Non profit venture promoting sustainable global development, with an interest in innovative data display. Accessible at: http://www.gapminder.org/ MAPresso (Herzog A). Downloadable Java applet that can be used to generate different cartogram formats, including ‘Dorling Cartograms’ on local shape files and data. Accessible at:http://www.mapresso.com/ Handout References Dorling D. Area Cartograms: Their Use and Creation. 1996. Concepts and Techniques in Modern Geography series no. 59, University of East Anglia: Environmental Publications. Contact: christopher.chiswell@nhs.net Resources