1 / 2

レベル測定結果(H20.10.12) 6 測線、 50 cmピッチ   高さは、護岸上を DL+300cm とした相対値です   レベルのコンターは10cm毎

レベル測定結果(H20.10.12) 6 測線、 50 cmピッチ   高さは、護岸上を DL+300cm とした相対値です   レベルのコンターは10cm毎   段差は、 4.25 mおよび、 10.0 mのところにあります。   大きな変化はありません。. 0m 4m         10m   12 m. レベル測定結果の比較(H20.10.12-9.27) 6 測線、 50 cmピッチ、 右図は、 2 回の測定の差(cm)を示しています。   着色域は、 1.5cm 以上の堆積(青)、 1.5cm の浸食(赤)を示します。

minya
Download Presentation

レベル測定結果(H20.10.12) 6 測線、 50 cmピッチ   高さは、護岸上を DL+300cm とした相対値です   レベルのコンターは10cm毎

An Image/Link below is provided (as is) to download presentation Download Policy: Content on the Website is provided to you AS IS for your information and personal use and may not be sold / licensed / shared on other websites without getting consent from its author. Content is provided to you AS IS for your information and personal use only. Download presentation by click this link. While downloading, if for some reason you are not able to download a presentation, the publisher may have deleted the file from their server. During download, if you can't get a presentation, the file might be deleted by the publisher.

E N D

Presentation Transcript


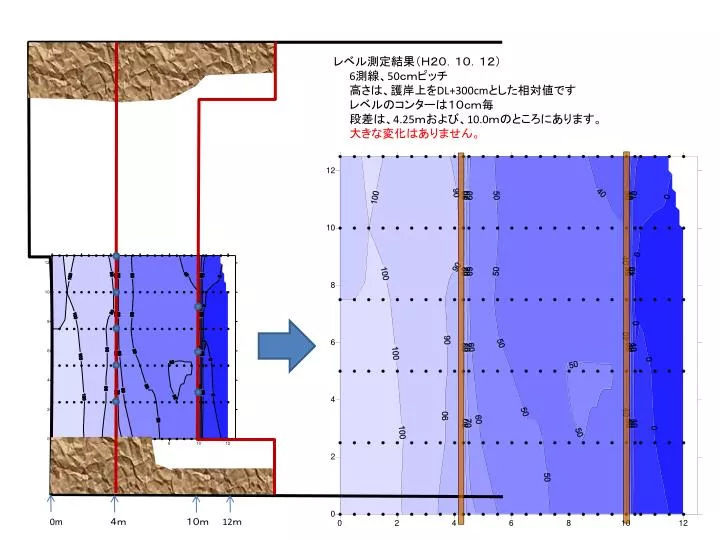
  1. レベル測定結果(H20.10.12) 6測線、50cmピッチ   高さは、護岸上をDL+300cmとした相対値です   レベルのコンターは10cm毎   段差は、4.25mおよび、10.0mのところにあります。   大きな変化はありません。 0m 4m         10m  12m

  2. レベル測定結果の比較(H20.10.12-9.27)レベル測定結果の比較(H20.10.12-9.27) 6測線、50cmピッチ、 右図は、2回の測定の差(cm)を示しています。   着色域は、1.5cm以上の堆積(青)、1.5cmの浸食(赤)を示します。   段差は、4.25mおよび、10.0mのところにあります。   護岸近傍に、5cm程度の帯状の浸食が見られます。   最上段(3段目)の堆積傾向の場所は、前回侵食されたところの平坦化、   中段の堆積傾向の場所は、実質的な局所的な堆積が生じた結果です。   その他の変化はおおむね5cm以内です。

More Related