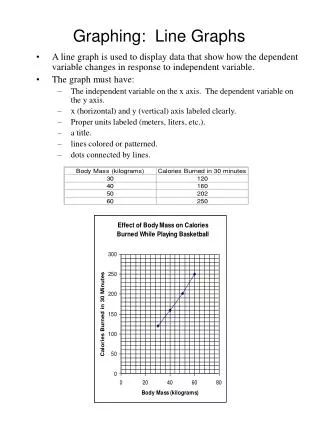
Download
1 / 17
200 likes | 421 Views
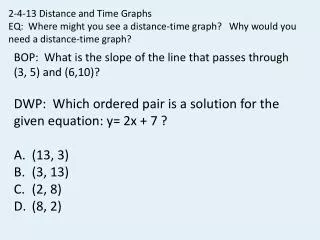
Graphing Distance-Time Graphs. (Calculating Speed and Average Speed). Important Graphing Information. 1. Draw your axes. 2. Label your axes. 3. Choose your intervals. 4. Choose appropriate spacing between intervals. 5. Plot your data. 6. Draw a line best fit. 7. Give your graph a title.

E N D
GraphingDistance-Time Graphs (Calculating Speed and Average Speed)
Important Graphing Information 1. Draw your axes 2. Label your axes 3. Choose your intervals 4. Choose appropriate spacing between intervals. 5. Plot your data 6. Draw a line best fit 7. Give your graph a title
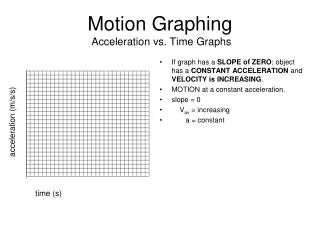
What does the line represent in a distance – time graph? • SPEED Two types of lines used in a distance – time graph. • 1. STRAIGHT LINE • 2. CURVED LINE
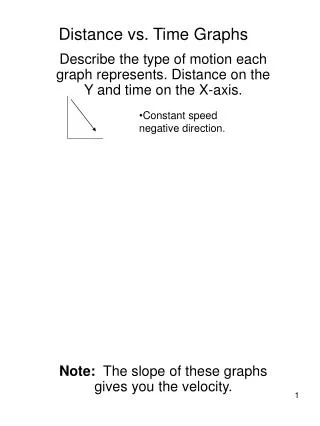
A straight, diagonal line indicates… • Constant Speed Why is the line in a constant speed graph straight and diagonal? • The object is traveling the same distance in the same amount of time.
A curved line indicates… • Changing Speed
Distance-Time Graph and Changing Speed What do the different lines indicate when an object is changing speed? • Slowing down Downward Curve Horizontal Line Upward Curve • Stopping • Speeding Up
How to determine total average speed by looking at a line graph • Find total distance (ending distance) 2. Divide by total time (ending time)
Comparing speeds on a Distance – Time Graph 1. Find the average speed of each line. 2. Compare the steepness of each line. The steeper line indicates: Faster Speeds
Your graph should look like this. • Calculate the average speed. • How long did the car stop for?
On the same graph, but in a new color fill in the following information. • Calculate the average speed. • Which had a greater average speed? • How long did the second car stop for?
Practice Average Speed B. Airplane C. Car D. Racehorse E. Bike Rider The distance-time graph shows the distance that eight different objects cover in 120 seconds or less. Each letter corresponds to a specific object. Figure out the correct average speed for each object.