Download
1 / 20
210 likes | 365 Views
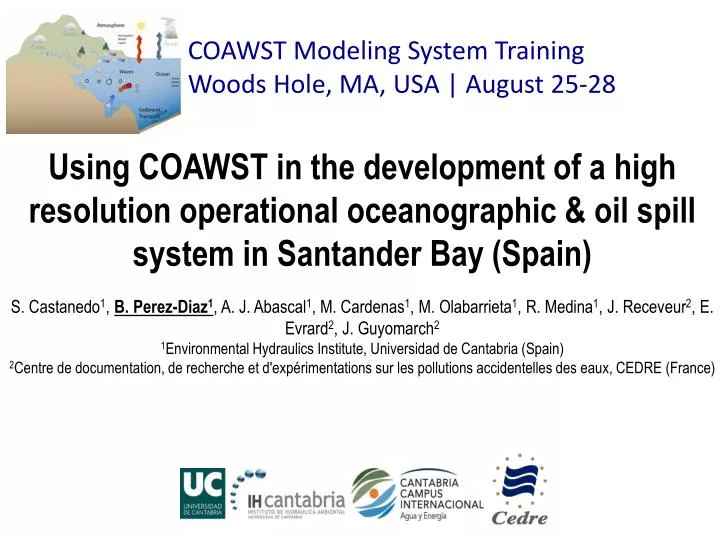
COAWST Modeling System Training Woods Hole, MA, USA | August 25-28. Using COAWST in the development of a high resolution operational oceanographic & oil spill system in Santander Bay ( Spain )

E N D
COAWST Modeling System Training Woods Hole, MA, USA | August 25-28 Using COAWST in the development of a high resolution operational oceanographic & oil spill system in Santander Bay (Spain) S. Castanedo1, B. Perez-Diaz1, A. J. Abascal1, M. Cardenas1, M. Olabarrieta1, R. Medina1, J. Receveur2, E. Evrard2, J. Guyomarch2 1Environmental HydraulicsInstitute, Universidad de Cantabria (Spain) 2Centre de documentation, de recherche et d'expérimentations sur les pollutionsaccidentelles des eaux, CEDRE (France)
1. INTRODUCTION Framework SPRES project, co-funded by the European Transnational Programme Duration of the project 2.5 years (9/01/2012 – 9/07/2014) Total budget: ≈1.8 M€ (ERDF co-financing rate: 65%)
1. INTRODUCTION Objective 4 • Operational forecasting systems • (HR-OOS) • Oil spill risk assessment tools 3 Santander Bay 2 - local scale - (estuaries and ports) 1
1. INTRODUCTION Sardinero Beach hmax of 10–12 m Puntal spit 0.8 km 3.5 km Miera river Santander Port Airport Santander 2270 ha (65% intertidal areas) 250,000 inhabitants • Mean tide range = 3 m • Spring tide range = 5 m • Daily mean fresh water discharge = 8 m3/s • Mean Hs= 1m • Typical winter storm wave: Hs=5 m.
2. SYSTEM SETUP Atmospheric data (AEMET) Ocean data (MyOcean) Sea level, 2D currents, T, S Wind, SLP, Heat fluxes FTP FTP Data preprocessing HR-OOM Wind COAWST model Marine forecast maps 2 day forecast of ocean variables Spill characteristics HR-OSM TESEO model 2 day forecast of spill trajectories Oil spill trajectory forecast
2. SYSTEM SETUP INITIAL AND OPEN BOUNDARY CONDITIONS MyOcean– IBI dt: 1 hour (2D), 1 day (3D) dx: 1/36º dz: 50 layers Forecast: 5 days • Sea level • 3D T and 3D S • 2D currents • 3D currents ATMOSPHERIC FORCING dt: 1 hour dx: 15 km Forecast: 72 hr • Wind fields and SLP • Heat Fluxes
2. SYSTEM SETUP GRIDS: Dynamic downscaling MYOCEAN-IBI GRID (1/36°) INTERMEDIATE GRID LOCAL GRID • Two-waynesting • Horiz.: cartesian coord. • Vert.: Sigma coord.
2. SYSTEM SETUP Atmospheric data (AEMET) Ocean data (MyOcean) Sea level, 2D currents, T, S Wind, SLP, Heat fluxes FTP FTP Data preprocessing HR-OOM Wind COAWST model Marine forecast maps 2 day forecast of ocean variables Spill characteristics HR-OSM TESEO model 2 day forecast of spill trajectories Oil spill trajectory forecast
3. VALIDATION • HR-OOM Calibration/validation of COAWST • Bottom friction coefficient • Horizontal and vertical turbulence models Calibration/validation of TESEO • HR-OSM • Transport module: wind drag, wave and diffusion coefficients • Weathering module: weathering coefficients
3. VALIDATION • HR-OOM Calibration/validation of COAWST • Data: • Permanent tide gauge operated by PdE located in the entrance of the Bay • River flow: flow meter operated by CHC (0.5 m3/s (summer camp.); 4.1 m3/s (winter camp.)) • Hydrodynamic campaigns: (1) Summer (17/07/2012 – 06/08/2012); (2) Winter (07/03/2013 – 25/03/2013) • Equipment: • Tide gauges • Micro-pressuresensors • Currentprofilers • Temperatureand salinitysensors
3. VALIDATION • HR-OOM Calibration/validation of COAWST • METHOD • To obtain the optimal hydrodynamic model parameters, comparing modeled results with observed values • Statistical descriptors: root mean square error (RMSE), correlation index (ρ) and the skill index. Winter campaign(2013)
Depth integrated current Sea level
3. VALIDATION • HR-OOM Calibration/validation of COAWST Summer campaign; Equipment: Aquadop (C3). a) Free surface elevation; b) depth average current velocity.
4. RESULTS • HR-OOM • 48 hoursforecast of hourly: • Sea level • 3D and 2D currents • 3D T and S • HR-OSM • 48 hoursforecast: • Oilspilltrajectory (real orhypothetical) • Oilspillweathering SPRES WEB SERVICE
Futurework • To increase wind data resolution • To include waves modeling • To include river flow input • To continue validating the system with measured data. • To increase grid resolution: curvilinear grid