Download
1 / 61
610 likes | 717 Views
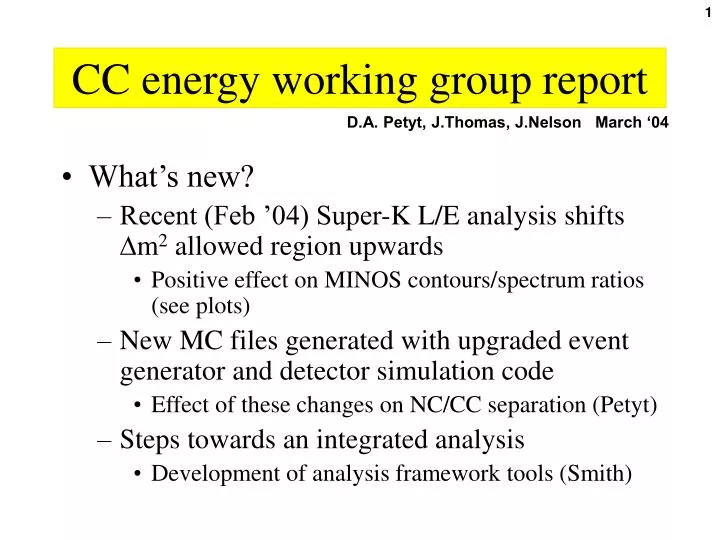
CC energy working group report. D.A. Petyt, J.Thomas, J.Nelson March ‘04. What’s new? Recent (Feb ’04) Super-K L/E analysis shifts D m 2 allowed region upwards Positive effect on MINOS contours/spectrum ratios (see plots)

E N D
CC energy working group report D.A. Petyt, J.Thomas, J.Nelson March ‘04 • What’s new? • Recent (Feb ’04) Super-K L/E analysis shifts Dm2 allowed region upwards • Positive effect on MINOS contours/spectrum ratios (see plots) • New MC files generated with upgraded event generator and detector simulation code • Effect of these changes on NC/CC separation (Petyt) • Steps towards an integrated analysis • Development of analysis framework tools (Smith)
The Super-K L/E analysis Idea is to cut out low resolution events (low E or cosq~0) to reduce smearing of the oscillation minimum Talk presented by M. Ishitsuka, NOON’04, Feb 2004
The Super-K L/E analysis Does not mean that a dip is observed at >3s though! Improved L/E resolution allows discrimination between oscillations & decay/decoherence Talk presented by M. Ishitsuka, NOON’04, Feb 2004
The Super-K L/E analysis Lower half of S-K 90% C.L. region is disfavoured by L/E analysis Talk presented by M. Ishitsuka, NOON’04, Feb 2004
MINOS limits for new Dm2 range • Rise in Dm2 is good for us: • Moves oscillation minimum to more favourable energies (for beam flux, event reconstruction and event selection) Dm2=0.0019 eV2 Dm2=0.00295 eV2 Dm2=0.0024 eV2
Sin22q<1 • A fairly hot topic at NOON 2004 (amongst the theorists, at least) • The higher Dm2 range of the new S-K data is more fabourable for measuring sin22q<1 in MINOS • Previous version of plot at right showed that discrimination at >90% was impossible inside old S-K allowed region (assuming 7.4e20 p.o.t.)
Update on CC/NC separation D.A. Petyt March ‘04 • Last time I showed some distributions from the new MC files, which were generated with NEUGEN 3. DetSim was used for the simulation of detector response. • The new MC has a significantly flatter y distribution than the old file – see plot below. This implies that CC/NC separation will be more difficult in the new MC file. • I have now looked at CC/NC separation with the new MC and present the first results in this talk. y distribution OLD file NEW file New file has a much flatter y distribution – is this an expected result of the recent changes to NEUGEN? – YES - HRG
Long Answer: d u size W Process target Q2 d • Kinematics are: • Well-defined for • each process • Very different for scaling / • non-scaling contributions • Q: Method for combining • resonance and DIS? ~ 1 GeV (form factor) ~ 1 fm d(W-M) Quasi-Elastic d The kinematics are: Well defined for each process Very different for scaling and Non-scaling pieces d d ~ 1 GeV (form factor) ~ MD (Breit-Wigner) ~ 1 fm Resonance Q2 independent parton model, phase space ~ 0 fm DIS d y-Distribution Changes: NEUGEN NEUGEN3 Short Answer: NEUGEN3 method for combining DIS / resonance cross sections takes into account local duality, and better describes n data. In combining resonance and DIS contributions, earlier versions of NEUGEN were tuned to get the exclusive channel cross sections right. This defines the amount of DIS reduction necessary. When the DIS differential cross sections were reduced, they were simply scaled down by this amount. Checked against: exclusive channel cross sections, total cross sections, exclusive channel ds/dq2, ds/dW.
Q2= 0.07 GeV2 Q2= 0.22 GeV2 Q2= 1. 4 GeV2 Q2= 0.8 5 GeV2 Q2= 3 GeV2 Q2= 9 GeV2 Q2= 1 5 GeV2 Q2= 2 5 GeV2 Theoretical Motivation: Duality • A current focus of JLab research. • Experimental observation (first made by Bloom and Gilman in the 1970s) that the DIS prediction for F2 is equal to the measured resonances, on average. • Input into recent models like Bodek-Yang (hep-ex/0308007). Works best with scaling variables that incorporate target mass and higher twist effects. • Implication: to combine cross sections, subtract the resonance contribution from the DIS amount in the kinematic region where they overlap. (from Bodek, NuINT 02)
Comparisons With Data: Combining DIS and non-scaling contributions to the cross section had been one of the areas where every neutrino MC seemed to do its own thing. Constraints from data were not as clear as one might expect: exclusive channel studies cuts on topology and W (typically W<1.4 GeV) DIS studies cuts on hadron energy (typically Ehad = 4 GeV) The published results that do exist on inclusive (including QEL) reactions do not unfold experimental resolutions. Fast MC simulating approximate ANL resolutions, cuts. <y> 2 GeV < En < 6 GeV Events NEUGEN3 NEUGEN2 Argonne H2 data Argonne H2 data y En (GeV) Barish et al PRD19 (1979) 2521.
PDFs used in this analysis CC NC Number of planes in track Fraction of pulse height in track Track pulse height per plane
Q: What causes the ‘spike’? Plots of track length vs true muon momentum DIS Quasi-elastic A: high-y DIS events where the muon is buried in the hadron shower. The ‘track’ length of these events will be approximately the same as NC events (10-20 planes). This is more common in the new file as there are more high-y events
Likelihood method for NC/CC separation • Calculate the probability that a given event comes from the CC or NC distributions: • Calculate a PID parameter (following Super-K) based on the difference in log likelihood between the CC and NC hypotheses CC NC
PID performance NEW file OLD file Overall performance similar, although CC efficiency is significantly worse for low E events
Comparison of selection efficiencies Lower CC efficiency at low E Higher NC background NEW file OLD file
Reco. effic. as a fn. of En and y Top – CC Bottom - NC * 0<y<0.25 0.25<y<0.5 0.5<y<0.75 0.75<y<1 True Neutrino Energy (GeV) *An event is ‘reconstructed’ if evthdr.ntrack>0 && trk[0].fit.pass==1
Selection effic – pid parameter>-0.3 * Top – CC Bottom - NC 0<y<0.25 0.25<y<0.5 0.5<y<0.75 0.75<y<1 Inefficient for high-y events True Neutrino Energy (GeV) *Selection efficiency – fraction of reconstructed events passing pid cut
Combined reco+selection efficiency Top – CC Bottom - NC 0<y<0.25 0.25<y<0.5 0.5<y<0.75 0.75<y<1 True Neutrino Energy (GeV)
Effect of flatter y-distribution • A flatter y-distribution in the new MC file implies a lower fraction of QEL events (or a higher fraction of DIS events) • Naively, would expect worse NC/CC separation for DIS events than QEL – this is shown in the next 3 slides Quasi-elastic Resonance Deep-inelastic
Reco & selection effics for various event types Algorithm is efficient for selecting QEL events… QUASI-ELASTIC RESONANCE DIS …but inefficient for selecting DIS events
Search for additional PDFs • I’ve looked at adding more variables to the likelihood function to try to improve NC/CC separation: • Variable 1: z direction cosine of track (measured at vertex) • Variable 2: track momentum from range divided by momentum from curvature Peaks at –1 – tracks are predominantly m- CC NC Mis-reconstructed events (or backward pions)
PID performance 3 parameters 4 parameters 5 parameters • These additional variables do not improve NC/CC separation • This implies that they are strongly correlated with existing 3 variables and therefore provide no additional information
Low energy behaviour – PDFs with a 50 plane cut Assume that events with tracks longer than 50 planes are CC-like PDFs for remaining events are shown above
PID performance with length cut CC NC Significant overlap between NC and CC PID distributions reflects the similarities in the underlying PDFs PID performance is not improved by the 50 plane cut
The problem at low pm • Efficiency for selecting events with low muon momentum (<1 GeV/c) is low • Not necessarily a low En problem – low pm events are either: • Low Enu QEL • High y DIS • Why is the efficiency so low for these events? • What do the PDFs look like for short events? All events Reconstructed Selected
PDFs for events with less than 15 planes 15 planes corresponds to pm~0.5 GeV/c Distributions are near-identical – these PDFs have no NC/CC discriminating power below 15 planes
Visual scan of short events • Motivation: • Pdfs for events with track length<15 planes are identical for CC and NC events. • Is this because I have chosen insensitive pdfs, or are the events truly indistinguishable? • Method: • Select a training sample of 25 CC events, 25 NC events • Perform a visual scan of these with full knowledge of the truth information – “calibrate the eye” • Select a second sample of 50 events (unknown number of CC and NC) • Perform a visual scan of these with no knowledge of the truth • An event is CC if: • There is a clear, continuous track in the event • The event must contain a leading track-like prong
Snarl 2739 transverse position (m) z position (m)
Snarl 2739 transverse position (m) z position (m) Truth: CC, En=1.17 GeV, y=0.29, pm=0.8 GeV/c
Snarl 2064 transverse position (m) z position (m)
Snarl 2064 transverse position (m) z position (m) Truth: NC, En=26.3 GeV, y=0.40
Snarl 2067 transverse position (m) z position (m)
Snarl 2067 - zoomed transverse position (m) z position (m)
Snarl 2067 - zoomed transverse position (m) z position (m) Truth: CC, En=3.48 GeV, y=0.75, pm=0.79 GeV/c
Snarl 2107 transverse position (m) z position (m)
Snarl 2107 transverse position (m) z position (m) Truth: CC, En=6.69 GeV, y=0.89, pm=0.67 GeV/c
Snarl 2721 transverse position (m) z position (m)
Snarl 2721 transverse position (m) z position (m) Truth: NC, En=4.13 GeV, y=0.80
Snarl 2366 transverse position (m) z position (m)
Snarl 2366 transverse position (m) z position (m) Truth: CC, En=2.12 GeV, y=0.83, pm=0.32 GeV/c
Event pathologies – tracking errors 1 transverse position (m) Missing hit Tracking error z position (m)
Event pathologies – tracking errors 2 transverse position (m) Missing hits Wrong vertex? z position (m)
Event pathologies – tracking errors 3 transverse position (m) Missing hits z position (m) Tracking through coil still a problem?
Event pathologies – tracking errors 4 transverse position (m) Wrong track z position (m)
Event pathologies – tracking errors 5 Wrong hits transverse position (m) z position (m)