Download
1 / 16
160 likes | 295 Views
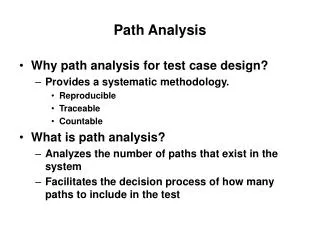
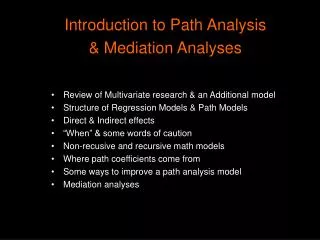
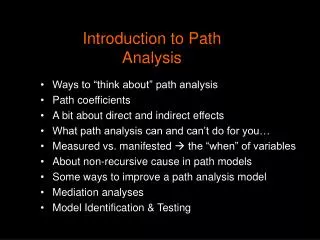
Introduction to Path Analysis. Reminders about some important regression stuff Boxes & Arrows – multivariate models beyond MR Ways to “think about” path analysis A bit about direct and indirect effects A bit about mediation effects measured vs. manifested the “when” of variables

E N D
Introduction to Path Analysis • Reminders about some important regression stuff • Boxes & Arrows – multivariate models beyond MR • Ways to “think about” path analysis • A bit about direct and indirect effects • A bit about mediation effects • measured vs. manifested the “when” of variables • What path analysis can and can’t do for you… • About non-recursive cause in path models • Some ways to improve a path analysis model
The first multivariate model most of us learn is multiple regression • y’ = b1x1 + b2x2 + b3x3 + a & Zy’ = β1Zx1 + β2Zx2 + β3Zx3 • Things we study when learning this model … • Colinearity -- the difference between the information and interpretation of bivariate r & b & or multivariate b • how the amount and pattern of colinearity influences this difference between bivariate r & b & or multivariate b • Suppressor effects – greater/differently signed multivariate contribution that expected based on bivariate r & b • colinearity patterns at their most interesting & informative
Things we learn when learning this model (cont.) … • Underspecification – our datasets/models don’t include all the relevant predictors (causal agents) • combined with colinearity & suppressor effects, this means that the contribution of a predictor to “this model,” may not be the same as its contribution to the “complete model" • Raw vs. Standardized weights -- the difference between b & β • the greater comparability of β than b to compare the relative unique contribution of predictors to the model • Causation -- the causal interpretability of the results of statistical analysis is dependent upon the design used to collect the data, not the statistical model used • statistical control =/= experimental control • “effect on” means “statistical relationship with” not “causal of”
One way to “think about” path analysis is as a way of “sorting out” the colinearity patterns amongst the predictors – asking yourself what may be the structure -- temporal and/or causal relationships -- among these predictors that produces the pattern of colinearity. “Structure” of a MR model – with hypotheses about which predictors will contribute A proposed structure for the colinearity among the predictors and how they relate to the criterion – with hypotheses about which paths will contribute 1 2 1 3 3 Crit Crit 5 4 4 2 5 earlier later final cause local cause
Alternative ways to “think about” path analysis… • to capture the “causal paths” among the predictors and to the criterion • to capture the “temporal paths” among the predictors and to the criterion • to distinguish “direct” and “indirect” paths of relationship • to investigate “mediation effects”
… to distinguish “direct” and “indirect” paths of relationship… • 2 has a direct effect on Crit • a “contributor” in both the regression and the path models • the regression model 1 3 Crit 5 4 2 • 5 does not have a direct effect on Crit – but does have multiple indirect effects • not “contributing” in the regression model could mistakenly lead us to conclude it “5 doesn’t matter in understanding Crit” 1 3 Crit 5 4 2
…to distinguish “direct” and “indirect” paths of relationship…, cont. 1 3 has a direct effect on Crit 3 Crit 5 4 2 • 3 also has an indirect effect on Crit • there’s more to the 3 Crit relationship than was captured in the regression model 1 3 Crit 5 4 2
… to investigate “mediation effects”… Mediation effects and analyses highlight the difference between bivariate and multivariate relationships between a variable and a criterion (collinearity & suppressor effects). • For example… • For Teaching Quality & Exam Performance r = .30, p = .01 • for binary regression β = r, so we have the path model… β=.3 TQ EP • It occurs to one of the researchers that there just might be something else besides Teaching Quality related to (influencing, even) Exam Performance. • The researcher decides that Study Time (ST) might be such a variable. • Thinking temporally/causally, the researcher considers that Study Time “comes in between” Teaching and Testing. • So the researcher builds a mediation model, getting the weights from a multiple regression with TQ and ST as predictors of EP
… to investigate “mediation effects”… The resulting model looks like … β=.0 TQ EP ST β=.3 β=.4 We might describe model as, “The effect of Teaching Quality on Exam Performance (r=.30) is mediated by Study Time.” We might describe the combination of the bivariate analysis and the multiple regression from which the path coefficients were obtained as, “While Teaching Quality has a bivariate relationship with Exam Performance (r=.30), it does not contribute to a multiple regression model (β=.0)that also includes Study Time (β=.40). Either analysis reminds us that the bivariate contribution of a given predictor might not “hold up” when we look at that relationship within a multivariate model! Notice that TQ is “still important” because it seems to have something to do with study time – an indirect effect upon Exam Performance.
What path analysis can and can’t accomplish… • Cans -- for a given structural model you can… • evaluate the contribution of any path or combination of paths to the overall fit of that structural model • help identify sources of suppressor effects (indirect paths) • Can’ts • non-recursive (bi-directional) models • help decide among alternative structural models • provide tests of causality (unless experimental data) • So… You have to convince yourself and your audience of the “reasonableness” of your structural model (the placing of the predictors), and then you can test hypotheses about which arrows amongst the variables have unique contributions.
The “when” of variables and their place in the model … • When a variable is “measured” when we collect the data: • usually concurrent • often postdictive (can be a problem – memory biases, etc.) • sometimes predictive (hypothetical – can really be a problem) • When a variable is “manifested” when the value of the variable came into being • when it “comes into being for that participant” • may or may not be before the measure was taken • E.g., State vs. Trait anxiety • trait anxiety is intended to be “characterological,” “long term” and “context free” earlier in model • state anxiety is intended to be “short term” & “contextual” depends when it was measured
About non-recursive (bi-directional) models 1 Sometimes we want to consider whether two things that “happen sequentially” might have “iterative causation” – so we want to put in a back-and-forth arrow 3 Crit 5 4 2 1 Sometimes we want to consider whether two things that “happen at the same time” might have “reciprocal causation” – so we want to put in a sideways arrow 3 Crit 5 4 2 Neither of these can be “handled” by path analysis. However, this isn’t really a problem because both are a misrepresentation of the involved causal paths! The real way to represent both of these is …
The things to remember are that: • “cause takes time” or “cause is not immediate” • even the fastest chemical reactions take time • behavioral causes take an appreciable amount of time • Something must “be” to “cause something else to be” • a variable has to be manifested as an effect of some cause before it can itself be the cause of another effect • Cause comes before effect not at the same time • When you put these ideas together, then both “sideways” and “back-and-forth” arrows don’t make sense and are not an appropriate portrayal of the causations being represented. • The causal path has to take these two ideas into account…
About non-recursive (bi-directional) models 1 If “5” causes “4”, then “4” changes “5”, which changes “4” again, all before the criterion is caused, we need to represent that we have 2 “4s” and 2 “5s” in a hypothesized sequence. 3 Crit 5 4 2 5 5 4 4 Crit 1 We also have to decide when1, 2 & 3 enter into the model, temporally &/or causally. Say … 3 5 5 4 4 Crit 2
About non-recursive (bi-directional) models, cont… 1 When applying these ideas to “sideways arrows” we need to remember that the cause comes before the effect. 3 Crit 5 4 2 To do that, we have to decide (& defend) which comes first – often the hardest part) and then add in the second causation, etc.… As well as sort out where the other variables fall temporally &/or causally. Perhaps … 1 4 1 3 Crit 5 2
Some of the ways to improve a path analysis For a given model, consider these 4 things…. TQ EP ST • Antecedents to the current model • Variables that “come before” or “cause” the variables in the model • Effects of the current model • Variables that “come after” or “are caused by” the variables in the model • Intermediate causes • Variables that “come in between” the current causes and effects. • Non-linear variations of the model • Curvilinear & interaction effects of & among the variables