Download
1 / 3
30 likes | 191 Views
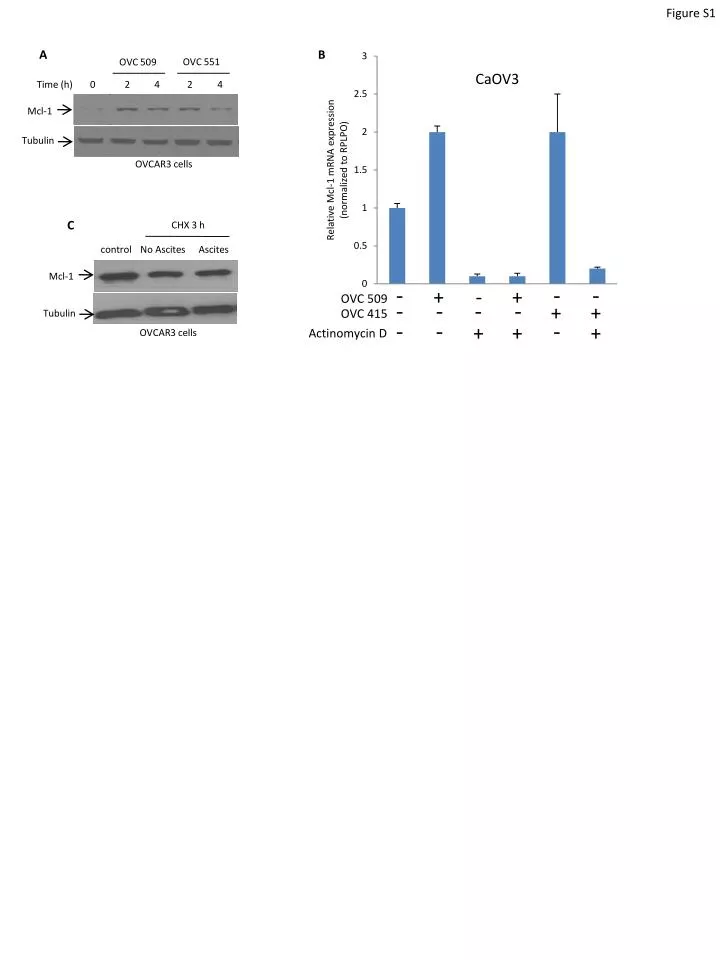
Figure S1. A. B. OVC 551. OVC 509. CaOV3. Time (h). 0. 2. 4. 2. 4. Mcl-1. Tubulin. OVCAR3 cells. C. CHX 3 h. control. No Ascites. Ascites. Mcl-1. -. -. -. +. -. +. OVC 509. -. -. -. -. +. +. OVC 415. Tubulin. -. -. -. +. +. +. Actinomycin D.

E N D
Figure S1 A B OVC 551 OVC 509 CaOV3 Time (h) 0 2 4 2 4 Mcl-1 Tubulin OVCAR3 cells C CHX 3 h control No Ascites Ascites Mcl-1 - - - + - + OVC 509 - - - - + + OVC 415 Tubulin - - - + + + Actinomycin D OVCAR3 cells
Figure S2 CaOV3 cells A B Control siRNA Mcl-1 siRNA 24 h 48 h - - + + ascites - - - vehicle + - - - Control siRNA + Bcl-2 - - + Mcl-1 siRNA + Bcl-XL Mcl-1 Tubulin ERK1/2
Figure S3 A B 2 h exposure to various ascites CaOV3 No ascites OVC 551 OVC 509 OVC 415 OVC 508 OVC439 0h 2h 4h pAkt pAkt Akt Akt CaOV3