Download
1 / 12
120 likes | 323 Views
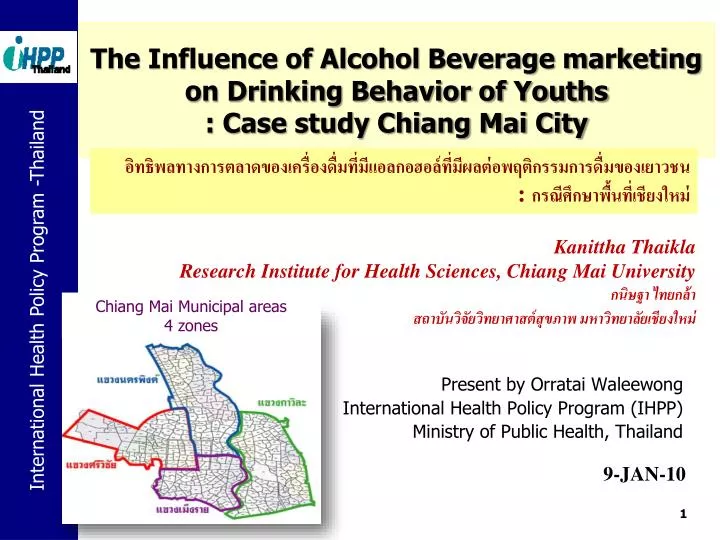
อิทธิพลทางการตลาดของเครื่องดื่มที่มีแอลกอฮอล์ที่มีผลต่อพฤติกรรมการดื่มของเยาวชน : กรณีศึกษาพื้นที่เชียงใหม่. The Influence of Alcohol Beverage marketing on Drinking Behavior of Youths : Case study Chiang Mai City. Kanittha Thaikla Research Institute for Health Sciences, Chiang Mai University

E N D
อิทธิพลทางการตลาดของเครื่องดื่มที่มีแอลกอฮอล์ที่มีผลต่อพฤติกรรมการดื่มของเยาวชน: กรณีศึกษาพื้นที่เชียงใหม่ The Influence of Alcohol Beverage marketing on Drinking Behavior of Youths: Case study Chiang Mai City Kanittha Thaikla Research Institute for Health Sciences, Chiang Mai University กนิษฐา ไทยกล้า สถาบันวิจัยวิทยาศาสต์สุขภาพ มหาวิทยาลัยเชียงใหม่ Chiang Mai Municipal areas 4 zones Present by Orratai Waleewong International Health Policy Program (IHPP) Ministry of Public Health, Thailand 9-JAN-10
Objectives • To study how to youth choose to buy alcoholic beverages and their drinking practice in different context of alcohol outlets around campus/university • To study related factors that make decision to buy and drink • To study the influence of alcohol marketing and promotion that impact on youth drinking practice in different context
Density, Clustering, Distribution Of Alcohol Outlets • Alcohol outlets & colleges were mapped though use of a hand held GPS (Global Positioning Satellite) unit. • Nearest -neighbor analysis :a statistical method for evaluating the geographic distribution :examines the distances between each point and the closest point to it : describe distribution >>Random, Clustered, Regular
Alcohol outlets : around campus/university - 997 alcohol outlets - Clustered distribution = 704 (70.6%) outlets are in 500 meters around campus. =80 Campuses/universities = Area of 500 meters around campus
Alcohol outlets around university High density 83 outlets around university Low density 3 outlets around university = Area of 500 meters around campus • = Alcohol outlets
Increasing alcohol outlets in 2009 Lately 2009 Early 2009 15.7% increasing (997 1186 outlets) 1 outlet per 124 people or 1 outlet per km2
Type & Numbers of alcohol outlets 263 grocery stores > 168 “Lhao- Tong” shops 209 restaurants> Note Lhao-Tong: Alcohol that sale divided by specific container (North people called “Tong”, cc) 70 % of “Lhao-Tong” shops are in area of 500 meters around campus.
Youth Drinking Practice Sample: 2,338 Students (male 1488, female 850) based on the survey of alcohol consumption in North (male 50.1%,female 16.9 %) 20.4% Never 14.2% Never 20.7% Sometimes 21.3% Sometimes 53% Always 66.4% Always 1606 students in highdensity area 53+21.3=74.3% drinking > 732 students in low density area 66.4+20.7=87.1% drinking Note: It’s not compare the resident of students, but it’s compare between their campus.
Compare youth drinking practice in different outlets density
Age of drinking initiation in different outlets density Male Female Age of drinking initiation male < female Age of drinking initiation Age 15.98 (range 8-23) Age 15.42 (range 6-20) < Low density High density Different, Sig.
Billboards and Advertisement : around campus/university • Advertisement are where the shops are. Advertisement mean that “ Alcohol available here” • 1,010 of advertisement tag (934 in high density+77 in low density) • Flag tag (51.5 %) > Light tag (16.8%) >Fabric tag with name’s shop (6.6%) • The others (16.4 %): Owners of alcohol branded merchandise Tissue holder > Table cover= Umbrella > Lamp > >
Relationship between alcohol marketing & youth drinking practice in different outlets density * Adjust Odds ratios (95% confidence interval) These factors influence to drinking behavior of students