Download

1 / 50
500 likes | 577 Views
Definitions. Operations research (O.R.) is the discipline of applying advanced analytical methods to help make better decisions From an organizational point of view, OR is something that helps management achieve its goals using the scientific process

E N D
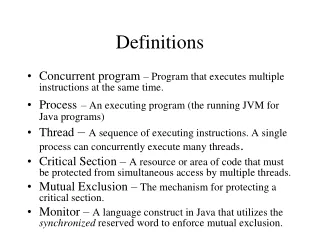
Definitions • Operations research (O.R.) is the discipline of applying advanced analytical methods to help make better decisions • From an organizational point of view, OR is something that helps management achieve its goals using the scientific process • The goal of OR is to provide rational bases for decision making by seeking to understand and structure complex situations, and to utilize this understanding to predict system behaviour and improve system performance.
Operations Research Conventional computing is not enough • Cannot enumerate alternatives • Combinatorial explosion of viable options “Few” alternatives Never got outside the box
Optimisation = Efficiency + Savings • Kellogg’s • The largest cereal producer in the world. • LP-based operational planning (production, inventory, distribution) system saved $4.5 million in 1995. • Procter and Gamble • A large worldwide consumer goods company. • Utilised integer programming and network optimization worked in concert with Geographical Information System (GIS) to re-engineering product sourcing and distribution system for North America. • Saved over $200 million in cost per year. • Hewlett-Packard • Robust supply chain design based on advanced inventory optimization techniques. • Realized savings of over $130 million in 2004 Source: Interfaces
definitions • Model: A schematic description of a system, theory, or phenomenon that accounts for its known or inferred properties and may be used for further study of its characteristics. • System: A functionally related group of processes Process Output Input
What is a system? Process Output Input • Desired and undesired • Planned and unplanned Environment Process Process Process
Why use OR? • Complexity of problems • Scattered responsibility and authority • Uncertainty • Knowledge explosion
Characteristics of or • Planned and scientific approach to problem solving • Adopt ion of an interdisciplinary approach • Use of scientific analysis instead of intuition or individual judgement • Continuous and appropriate use of OR leads to consistency and factual decision making • All problems and the influencing factors are measured
Essential characteristics of decision-making • objectives, • Alternatives or options • influencing factors (constraints).
Levels of decision-making • Decision-making based on intuitions • Decision-making based on qualitative comparisons • Decision-making based on data and quantitative analysis of factors
Typical Applications grouped by function • Planning, Strategic Decision-Making • Production • Distribution, Logistics, Transportation • Supply Chain Management • Marketing Engineering • Financial Engineering
broad groups of methods • Deterministic and probabilistic methods • Used for calculating the outcomes of various operation activities or a set of operation activities. • Deterministic - activities can be predicted • Probabilistic – uncertainties in the course of activities • Descriptive • There are no precise mathematical formulations. The objective is to find a model to describe the situation based on past real data • Optimizing methods • Used to enable the decision maker to search among possible choices in an efficient and effective manner, in environments where thousands or millions of choices may actually be feasible, or where some of the comparing choices are rather complex. The ultimate goal is to identify and locate the very best choice based on certain criteria.
broad groups of methods • Simulation methods • the goal is to develop simulators that provide the decision-maker with the ability to develop scenarii to simulate possible improvement actions or potential risks • ‘What if’ situations • Data-analysis methods • the goal is to aid the decision-maker in detecting actual patterns and inter-connections in the data set. This method is rather useful in numerous applications including forecasting and data mining based business environments. • Qualitative and quantitative methods • Used to quantify situations , which previously have been described qualitatively
OR techniques • Linear programming • Dynamic programming • Inventory control • Queuing theory • Decision theory • Network techniques • Simulation • Replacement theory
choice of mathematical models • By degree of abstraction – how far they can represent real life situation • By function – the type of problem to be solved • By structure – nature of data / problem, complexity of factors • By nature of the environment – how far future operations can be predicted • By the extent of generality – is the problem specific or not? • By the time horizon
Seven Steps of OR Study • Formulate the problem • Organisation’s objectives and the focus of the study • Observe the system • Collect data to evaluate factors which affect the problem • Formulate a mathematical model of the problem • Choose the most appropriate OR technique and mathematical model • Verify the model and use it for prediction • Select a suitable alternative • Present the results and conclusions • Implement and evaluate recommendation
Identify the role of participants • Problem owner – often the decision-maker • Problem user - implementor of solutions • Problem customer – beneficiary / victim of consequences • Problem solver – people or team involved in the analysis and proposal of solutions to the problem owner
What is a problem? • Dissatisfaction with the process outcomes or the way tasks are executed • Goals and objectives not met • Inconsistencies in the results • It is negative • It is not the lack of a solutions
Defining the problem • Can the problem be expressed in quantitative terms? • Are the required data available or can they be generated at reasonable cost? • Does the cost of the analysis justify the likely benefits to be derived from the implementation of the results? • To what extent can we meet the project sponsor’s expectations? • If there are no data, devise your own data collection system. You determine the accuracy level, the quantum and the depth of the data collection.
Case 1: The Staff Rostering Problem • What is the optimal staff allocation? • Consider a Childcare Centre: • The childcare centre is operating 5 days/week. • There are 10 staff members. • Each staff member is paid at an agreed daily rate, according to the skills they possess. • One shift per day • Skills can be categorised into 5 types. • (Singing,Dancing) • (Arts) • (Sports) • (Reading,Writing) • (Moral Studies,Hygiene)
…other information • CONSTRAINTS: • Skill Demand • The daily skill demand is met. • Equitability (breaks,salaries) • Each staff member must at least work 2 days/week and can at most work 4 days/week. • Workplace Regulation • On any day, there must be at least 4 staff members working. • OBJECTIVE: • Minimise Total Employment Cost/Week
Other Issues and Challenges • Breaks • scheduled breaks • annual leave • festive breaks (under-staffing issues) • Fatigue • limit to number of working hours per day/week/fortnight (Union Requirements) • Equitable roster • equitable weekend/night shifts • Motivation • skill utilisation (avoid monotonous job routine) • Training • training and development (scheduled)
Operations Research Case 2: New Haven Needle Exchange Fights AIDS • The problem • With the advent of HIV and AIDS in the early 1990s, the City of New Haven instituted a needle exchange program as a way of reducing the spread of infection among intravenous drug users • New Haven asked Yale University to determine if the program was actually making progress in the fight against HIV and AIDS
Operations Research New Haven (con’t) • Objectives and requirements • Develop a syringe tracking and testing system • Model HIV transmission in New Haven • Estimate model parameters from the data collected in New Haven • Determine if the program is reducing infection rates and saving lives • Recommend continuation or discontinuation of the program.
Operations Research New Haven (con’t) • The OR solution • Yale researchers developed: • A syringe tracking and testing system to “interview the needles” rather than rely on addicts’ self-reporting • A Needles That Kill (NTK) model to forecast the incidence of new HIV infections • The modelers made adjustments to determine: • Frequency of shared drug injection • Probability that kits given to addicts for cleaning needles were effective • Departure rate from the population • Infectivity per injection • Per syringe exchange rate • Ratio of drug injectors to needles
Operations Research New Haven (con’t) • The value • The researchers were able to determine that needle exchange reduced the HIV infection rate among program clients by 33% • In response, the Connecticut legislature continued funding the program, expanded needle exchange services to Bridgeport and Hartford, and decriminalized syringe possession • New needle exchange programs and legislation were proposed in New York, California, and Massachusetts as a result
Operations Research Case 3: Forecasting the Shuttle Disaster at NASA • The problem • After the Challenger shuttle disaster in 1986, NASA decided to conduct risk analysis on specific systems to identify the greatest threats of a future disaster and prevent them • Consultants at Stanford University and Carnegie Mellon were called in to assess risk to the shuttle tiles
Operations Research NASA (con’t) • Objectives and requirements • Identify different possible accident scenarios • Compute the probability of failure • Show how safety could be increased • Prioritize recommended safety measures
Operations Research NASA (con’t) • The OR solution • Model was based on a multiple partition of the orbiter's surface • For the tiles in each zone, the OR team examined data to determine the probability of: • Debonding due to debris hits or a poor bond • Losing adjacent tiles once the first is lost • Burn-through • Failure of a critical subsystem under the skin of the orbiter if a burn-through occurs • A risk-criticality scale was designed based on the results of this model
Operations Research NASA (con’t) • The value • Found that 15% of the tiles account for about 85% of the risk • Recommended NASA inspect the bond of the most risk critical tiles and reinforce insulation of vulnerable external systems • Computed that such improvements could reduce probability of a shuttle accident from tile failure by 70% • 1994 study quoted extensively in the press after the Columbia, a second shuttle, exploded on reentry in 2003, apparently due to tile failure
Typical or situation in life • You are going to invite relatives for your wedding. You have no car. Your parents work from Mon to Sat. You work on a shift system, where sometimes you work during the day and sometimes at night. Your relatives are very dispersed geographically and the number of relatives per region vary substantially. You are thinking to rent a car or get the service of a taxi driver.
Typical or situations in business • Impact on oil prices on various sectors of the economy. • Rise in cotton prices – Demand for your garments is fluctuating – Demand for cotton garments is increasing • The company has five restaurants. It is the beginning of the last quarter of the year. What optimum human resources required in each restaurant? How many additional casual workers to employ?
Home work • A bank manager wants to reduce expenditures on tellers’ salaries while still maintaining an adequate level of customer service.
Linear programming – definition • Mathematical technique to: • solve problems related with allocation of scarce resources under different constraints • It is used to one specific problem at a time, which is the optimum product mix which will lead to either maximise profit or minimise costs • Typical objectives: maximum profit or minimum cost • Typical constraints: labour hours, machine hours, different orders or services sharing the same resources, varying work loads, process limitations
Requirements of linear programming • Problem must be capable of being stated in numeric terms • Consumption of resources is linear • Problem must permit a choice between alternative course of actions (different product mixes) • There must be one or more constraining factors involved
Expressing a linear problem • Objective function • Maximisation function • Minimisation function • Decision variables • Limitations or constraints • Maximum limits • Minimum limits • A mixture of maximum and minimum limits
Elements of a linear programming problem • Solution • Decision variable – elements of the product mix • Objective function coefficient– profit or cost per unit • Objective function – expression representing the total profit or cost of producing the elements of the product mix • Technological coefficient – amount of resources required for each element of the product mix • Resource availability • Set of constraints
assumptions • Linearity of the consumption of resources • Divisibility of decision variables is allowed • Non-negativity – decision variables are always equal to or greater than zero • Additivity – the output of a system is the sum of the output of each individual process
Properties of linear programming solution • The solution is feasible • Single optimal solution • No alternate optimum solutions
Example • Two Crude Petroleum distils crude from two sources: • Saudi Arabia, Venezuela • They have three main products: • Gasoline, Jet Fuel, Lubricants • Yield per barrel of crude oil • Availability and cost
Example • Production requirements per day • Objective: minimise production cost
Mathematical expression • Objective function x1 = production volume of Saudi Arabia x2 = production volume of Venezuela Minimum production cost = 20 x1 + 15 x2 • Constraints Gasoline constraint: 0.3 x1 + 0.4 x2 ≥ 2000 A jet fuel constraint: 0.4 x1 + 0.2 x2 ≥ 1500 B Lubricants constraint: 0.2 x1 + 0.3 x2 ≥ 500 C Saudi Arabia availability constraint: 0 ≤ x1 ≤ 9000 D Venezuela availability constraint: 0 ≤ x2 ≤ 6000 E
Graphical solution (750,6000) E (9000,6000) (2000,3500) D A C B (9000, 0) (6667,0)
GRAPHICAL SOLUTION • Minimum production cost = 20 x 2000 + 15 x 3500 = $92500 • Binding constraints = A, B, D, E • Shadow prices?
Limiting constraints • Shadow prices • Value of scarce resources • Increase in cost if one more unit of scarce resource was available
Shadow prices • Limiting constraints are production of gasoline and jet fuel • For each additional barrel of gasoline, shadow price = $20 • For each additional barrel of jet fuel, shadow price = $35
Sensitivity analysis • What if • the amount of any constraint changes • the price or cost of decision variable changes
Sensitivity analysis • What will be the new minimum production cost? • If the production cost of Saudi Arabia increases by $1 per barrel • If the production cost of Venezuela increase by $2 per barrel
Linear programming methods • Graphical method • Limited to two decision variables • Limited number of constraints • Simplex method • Any number of decision variables • Large number of constraints • Simplex method (Big M-Method) • Mixed constraints • Minimisation problems