Download
1 / 22
230 likes | 436 Views
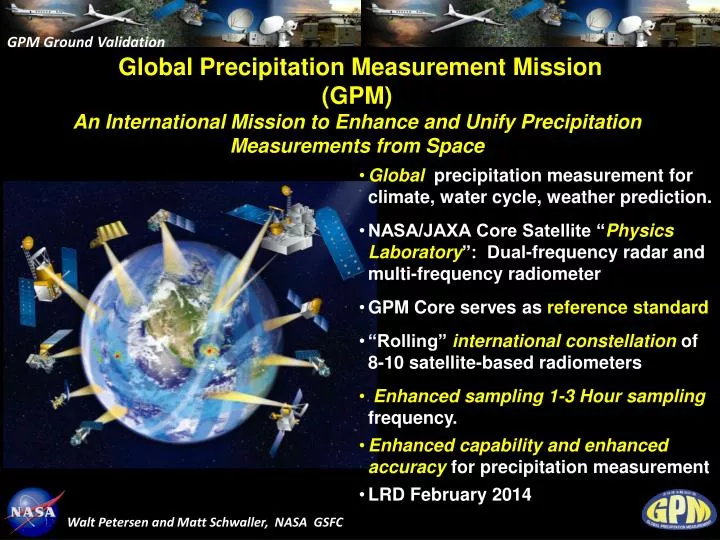
GPM Ground Validation. Global Precipitation Measurement Mission (GPM) An International Mission to Enhance and Unify Precipitation Measurements from Space. Global precipitation measurement for climate, water cycle, weather prediction.

E N D
GPM Ground Validation Global Precipitation Measurement Mission (GPM) An International Mission to Enhance and Unify Precipitation Measurements from Space • Global precipitation measurement for climate, water cycle, weather prediction. • NASA/JAXA Core Satellite “Physics Laboratory”: Dual-frequency radar and multi-frequency radiometer • GPM Core serves as reference standard • “Rolling” international constellation of 8-10 satellite-based radiometers • Enhanced sampling 1-3 Hour sampling frequency. • Enhanced capability and enhanced accuracyfor precipitation measurement • LRD February 2014 Walt Petersen and Matt Schwaller, NASA GSFC
NASA-JAXA GPM Core Observatory Core Observatory Measurement Capabilities Dual-Frequency (Ku-Ka band) Precipitation Radar (DPR): • Increased sensitivity (~12 dBZ) for light rain and snow detection relative to TRMM • Better measurement accuracy with differential attenuation correction • Detailed microphysical information (DSD mean mass diameter & particle no. density) & identification of liquid, ice, and mixed-phase regions Multi-Channel (10-183 GHz) GPM Microwave Imager (GMI): • Higher spatial resolution (IFOV: 6-26 km) • Improved light rain & snow detection • Improved signals of solid precipitation over land (especially over snow-covered surfaces) • 4-point calibration to serve as a radiometric reference for constellation radiometers Combined Radar-Radiometer Retrieval • DPR & GMI together provide greater constraints on precipitation retrieval for improved accuracy • DPR/GMI-constrained cloud database for constellation radiometer retrievals
A science mission with integrated application goals GPM Science Goals • New reference standards for precipitation measurements from space - using combined information from active and passive microwave sensors • Better understanding of water cycle variability, and freshwater availability - through better description of space-time distribution of precipitation processes • Improved numerical weather prediction skills - through better instantaneous precipitation information and associated error characterization • Improved hydrological prediction capabilities for floods, landslides, and freshwater resources - through downscaling and innovative hydrological modeling • Improved climate modeling and prediction capabilities - through better estimates of latent heating, precipitation microphysics, & surface water fluxes • Key to better global precipitation data products: • Accuracy of instantaneous precipitation estimate • Spatial coverage & temporal sampling (for improved estimation of precipitation accumulation) • Spatial resolution (for local-scale applications) • Data latency (for near real-time operational use)
GPM Ground Validation GPM Ground Validation Science Movingbeyond traditional direct validation/comparisonactivities byincorporating improved algorithm physics & applications • Three complementary approaches: • Direct Validation: • Leveraging off operational networks to identify and resolve first-order discrepancies between satellite and ground-based precipitation estimates • Physical process validation (vertical column): • Cloud system and microphysical studies geared toward testing and refinement of physically-based retrieval algorithms • Integrated hydrologic validation/applications (4-dimensional): • Identify space-time scales at which satellite precipitation data are useful to water budget studies and hydrological applications; characterization of model and observation errors
The Broader “Integrated GV” Context for IFloodS • “ ……provide a physical means for better understanding the strengths and limitations of the satellite products, while propagating that understanding in an end-to-end fashion into assessments and forecasts that rely solely on satellite products……” • How can GPM four-dimensional QPE and associated uncertainties be effectively used within the framework of global water and energy cycle applications including climate and weather prediction? • How can GPM four-dimensional QPE and associated uncertainties be effectively used in hydrometeorological applications such as soil moisture estimation, decision support for flood forecasting, and water resource management? • Characterization of uncertainties in satellite and ground-based (radar, dense gauge networks) rainfall estimates over a broad range of space/time scales • Characterization of uncertainties in hydrologic models and understanding propagation of input uncertainties into model forecasts • Assessing performance of satellite rainfall products in hydrologic applications over a range of space-time scales • Using data from synergistic missions (e.g. SMOS, SMAP, GRACE) to refine hydrologic model parameters and improve predictions driven by GPM input data
GPM GV Iowa Flood Studies (IFloodS) Specific Science Questions How do the physical characteristics and space/time variability of rain (rates, DSD, process/”regime”) map to satellite rainfall retrieval uncertainty? How does uncertainty in satellite rainfall retrieval propagate into/impact flood prediction applications ? How does predictive skill vary as a function of space and time scales, basin morphology, and land use? What are the relative roles of rainfall quantities such as rainfall rate and accumulation vis à vis the role of other factors (e.g. transport of water in the drainage network) in flood genesis (e.g. Gupta et al. 2010).
Measurements required at multitude of scales Radar to function as a “BRIDGE” between scales • Scale: Point to large-area measurements with an understanding of uncertainties • Synergistic use of relevant platforms with limited constraints on operation • Coupling across dimensions: It is a 4-D problem!!!!
GPM GV Measurement Infrastructure for IFloodS • PROPOSED IFLOODS DEPLOYMENT OF INSTRUMENTATION • Radars: Rain mapping, 4-D precip structure, DSD, rates • NPOL S-band transportable, scanning dual-pol radar • D3R radar: Dual-frequency (KA-KU), dual-polarimetric, Doppler radar. • 4* Metek Micro Rain Radars (K-band), vertically pointing (one on order) • Point-Network Disdrometer/Gauges: Precip character/reference • 6* 2D Video Disdrometers (*1 on order) • 16-20 Parsivel-2 Disdrometer with MetOne 12” TB Rain Gauge • Up to 6 Joss Waldvogel (possible) • 1-2 Precipitation Video Imager • 25 dual-gauge Met One TB rain gauges with soil T/Q (in preparation at U. Iowa) Dual-Gauge Net Precipitation Video Imager (PVI) JW
IFloodS Satellite Platforms/Dataset Archive • Individual Platforms (Raw and PPS Level 1C) [Via Kummerow, CSU CIRA] • SSM/I (F15), • SSMI/S (F16,17,18) • NOAA 16 (AMSU-A/B) • NOAA 18, 19 (AMSU-A/MHS) • TRMM TMI • METOP(A, B) (AMSU A, MHS) • Suomi-NPP (ATMS) • GOES (+ rapid scan) • Gridded Multi-Platform Rain Rate Products (G. Huffman*) • TMPA (0.25o, 3 hour) • CMORPH (0.07o, 0.5 hour) • GSMAP (0.25o, 1 hour) • PERSIANN (0.04o, 0.5 hour) • * Data source collaboration still TBC
Hydrologic Measurements Leveraging of Iowa Flood Center, Regional Partner/Collaborative Datasets (Many assets in place in several basins of interest- discuss this afternoon) Modeling Coupled Modeling: NASA Unified-WRF Real-Time Support (GSFC/MSFC) Land Surface/Hydrologic Modeling: Real-Time TRMM-based Flood Potential Modeling (GSFC) North American Land Data Assimilation System (NLDAS) Collaborations with: NOAA OHD, NCAR, North Central and Missouri RFCs Contributions from: PMM Hydrology WG members
NASA GPM-GV FIELD CAMPAIGN IFLOODS’13 Hydrologic Perspective IOWA Flood of 2008
Discussion Questions/Issues GPM/SMAP Iowa: Identify clear synergies that relate to IFloodS Science: Verify that we are asking the right questions- add specificity where needed IFloodS When: Based on flood frequency, suggest May 15 – July 1 IFloodS What: Proposed platforms, modeling, datasets , synergies etc. IFloodS Who: Need to identify the core set of “lead” participants (Field planning, instrument PI’s, science participants)* *A little difficult given the phasing of the proposal cycle but, need to press forward anyway. IFloodS Where: Straw-man: Large-scale Cedar and Iowa River Basins (HUC-6) with a focused network in much smaller Clear Creek Watershed (HUC-10) IFloodS How: Identify deployment logistics focal points Basic operations ideas for major radar platforms.
NASA GPM-GV FIELD CAMPAIGN IFLOODS’13 Why Iowa? • Iowa represents the “simple” case: • No costal effects • No orographic effects • Uniform land cover (farms) • also… • It rains there • It floods there • existing infrastructure IOWA
Discussion Questions/Issues GPM/SMAP Iowa: Identify clear synergies that relate to IFloodS Science: Verify that we are asking the right questions- add specificity where needed IFloodS When: Based on flood frequency, suggest May 15 – July 1 IFloodS What: Proposed platforms, modeling, datasets, synergies etc. IFloodS Who: Need to identify the core set of “lead” participants (Field planning, instrument PI’s, science participants)* *A little difficult given the phasing of the proposal cycle but, need to press forward anyway. IFloodS Where: Straw-man: Large-scale Cedar and Iowa River Basins (HUC-6) with a focused network in much smaller Clear Creek Watershed (HUC-10) IFloodS How: Identify deployment logistics focal points Basic operations ideas for major radar platforms.
NASA GPM-GV FIELD CAMPAIGN IFLOODS’13 Hydrologic Perspective • Iowa-Cedar River basin FACTS: • Area: 32,686 km2 • Population: ~1 million • “500-year” floods occurred in 1993 and 2008 • Mean precip: ~40” /year • Major agricultural region
NASA GPM-GV FIELD CAMPAIGN IFLOODS’13 Hydrologic goal HUC 6 HUC 8 HUC 12 “Subwatershed” Average size: 100 km2 “Basin” Average size: 27500 km2 “Subbasin” Average size: 1800 km2 Characterization of hydrologic processes across scales
NASA GPM-GV FIELD CAMPAIGN IFLOODS’13 Sub-watershed Perspective
NASA GPM-GV FIELD CAMPAIGN IFLOODS’13 Existing Infrastructure • USGS Stream gauges • IFC Bridge Sensors HUC 6 - scale
NASA GPM-GV FIELD CAMPAIGN IFLOODS’13 Instrument Deployment Suggested NPOL site: Cedar Falls, IA NEXRAD coverage up to 150km
NASA GPM-GV FIELD CAMPAIGN IFLOODS’13 Instrument Deployment Rain gauge + APU HUC 6 - scale Rain gauge platform
NASA GPM-GV FIELD CAMPAIGN IFLOODS’13 Instrument Deployment IOWA Clear Creek Watershed cluster site ~ 10 km ~ 30 km HUC 10 - scale