Download
1 / 1
10 likes | 143 Views
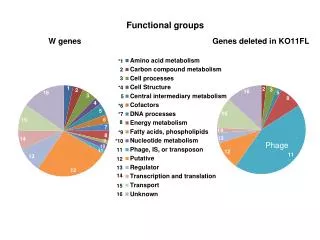
Using Dot plot analysis to learn about the A3 phage subcluster. Erin Sorge , Michelle Schmidt, Rachel Wilson. Summary of results

E N D
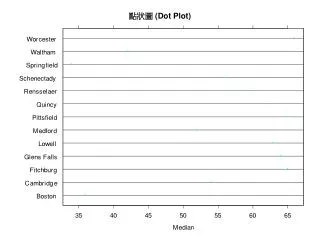
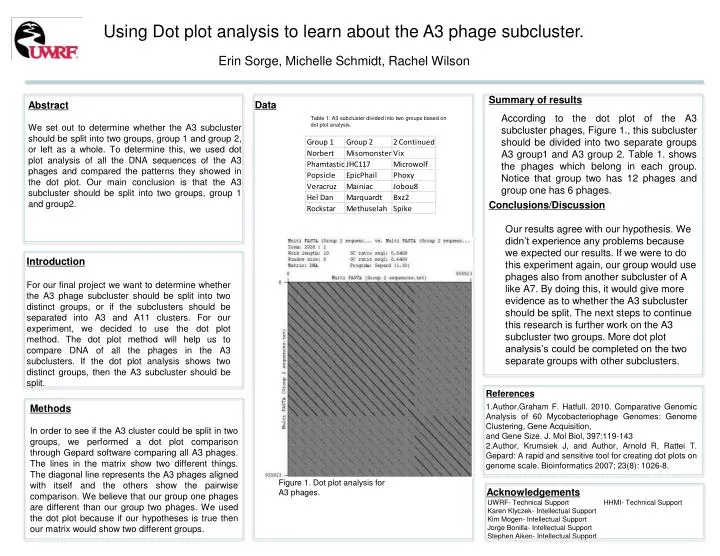
Using Dot plot analysis to learn about the A3 phage subcluster. Erin Sorge, Michelle Schmidt, Rachel Wilson Summary of results According to the dot plot of the A3 subcluster phages, Figure 1., this subcluster should be divided into two separate groups A3 group1 and A3 group 2. Table 1. shows the phages which belong in each group. Notice that group two has 12 phages and group one has 6 phages. Data Abstract We set out to determine whether the A3 subcluster should be split into two groups, group 1 and group 2, or left as a whole. To determine this, we used dot plot analysis of all the DNA sequences of the A3 phages and compared the patterns they showed in the dot plot. Our main conclusion is that the A3 subcluster should be split into two groups, group 1 and group2. Table 1. A3 subcluster divided into two groups based on dot plot analysis. Conclusions/Discussion Our results agree with our hypothesis. We didn’t experience any problems because we expected our results. If we were to do this experiment again, our group would use phages also from another subcluster of A like A7. By doing this, it would give more evidence as to whether the A3 subcluster should be split. The next steps to continue this research is further work on the A3 subcluster two groups. More dot plot analysis’s could be completed on the two separate groups with other subclusters. Introduction For our final project we want to determine whether the A3 phage subcluster should be split into two distinct groups, or if the subclusters should be separated into A3 and A11 clusters. For our experiment, we decided to use the dot plot method. The dot plot method will help us to compare DNA of all the phages in the A3 subclusters. If the dot plot analysis shows two distinct groups, then the A3 subcluster should be split. References 1.Author,Graham F. Hatfull. 2010. Comparative Genomic Analysis of 60 Mycobacteriophage Genomes: Genome Clustering, Gene Acquisition, and Gene Size. J. MolBiol, 397:119-143 2.Author, KrumsiekJ, and Author, Arnold R, Rattei T. Gepard: A rapid and sensitive tool for creating dot plots on genome scale. Bioinformatics 2007; 23(8): 1026-8. Methods In order to see if the A3 cluster could be split in two groups, we performed a dot plot comparison through Gepardsoftware comparing all A3 phages. The lines in the matrix show two different things. The diagonal line represents the A3 phages aligned with itself and the others show the pairwise comparison. We believe that our group one phages are different than our group two phages. We used the dot plot because if our hypotheses is true then our matrix would show two different groups. Figure 1. Dot plot analysis for A3 phages. Acknowledgements UWRF- Technical Support HHMI- Technical Support Karen Klyczek- Intellectual Support Kim Mogen- Intellectual Support Jorge Bonilla- Intellectual Support Stephen Aiken- Intellectual Support