Download
1 / 19
190 likes | 285 Views
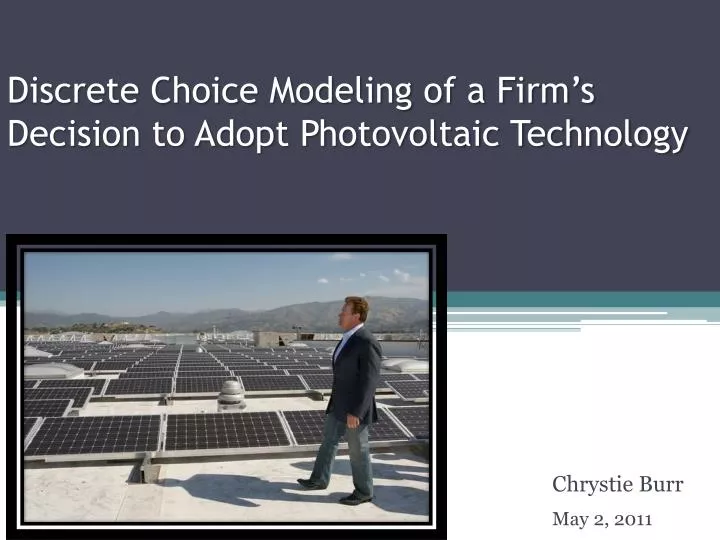
Discrete Choice Modeling of a Firm’s Decision to Adopt Photovoltaic Technology. Chrystie Burr May 2, 2011. TexPoint fonts used in EMF. Read the TexPoint manual before you delete this box.: A A.

E N D
Discrete Choice Modeling of a Firm’sDecision to Adopt Photovoltaic Technology Chrystie Burr May 2, 2011 TexPoint fonts used in EMF. Read the TexPoint manual before you delete this box.: AA
Develop an understanding of how firms respond differently to upfront subsidies and production subsidies. Develop a policy optimization framework for solar technology (policy target). Research Aims
Grid-connected solar power system Introduction: What is grid-connected PV?
Background - U.S. PV MarketCumulative Installation (1996-2008)
Background Global Market Share Solar PV Existing Capacity, 2009 (source: REN21)
Fastest growing energy technology in the last 5 years. Trends in Photovoltaic Application
Lower cost Government Incentive Programs Driver for the PV boom
Price of crystalline modules declined by 50-60% from $3.5/W to $2/W in 2008/2009. Background- PV Price Trends
Annual installed capacity (2002-2008) by states: Larry Sherwood (IREC) Subsidy: Dollar amount recovered from DSIRE database Electricity price: EIA Solar Irradiation: NREL # businesses: US small business admin. Data
Potential market: 30% Annual discount rate: 8% System lifespan: 20 years Average PV size: 20kW Elec. escalation rate: 10 year average Maintenance cost: $0.01/kWh Inverter cost: $0.75/W Annual degradation factor: 1% Solar electricity conversion factor: 76% Net metering: null Company located in the largest metropolitan area in a state Assumptions
At each time period, a non-residential unit (commercial firm) can choose to install an average sized PV panel or not adopt PV technology Decision is based on the annual revenue generated by the system and the upfront cost, both affected by the incentive programs. The purchasers leave the market. Discrete Choice Model
Firm’s profit function Model if not installed if installed • τuf: Upfront subsidy (% based) • ξmt: Fixed effect • f(ε) = eε/(1+ eε) • R: NPV of the future benefit and costs • Avoided utility cost • Production incentive • FC: Upfront installed cost
Model if not installed if installed • CAC: Avoided electricity cost for next 20 years • Local solar Irradiation • Electricity price • τp: Production subsidy • X: Increased revenue from • improved brand image • PAV: Ave. cost of 20kW system • W: State wage deviation from national mean • L: Learning effect. f(cum. install) • Code: Building codes depend on seismic activity and hurricane
EstimationHierarchical Bayesian approach • Let A = , Bi = [ ]T ~ lognormal(b, D), • Prior: b ~ N(0, s) s ∞, D ~ IW(3, V0) • Likelihood: • Posterior: K(Bi, b, D| Y) • Conditional posterior:
EstimationBayesian Procedure on BLP model Yang, S., Y. Chen, and G. Allenby (2003), ‘Bayesian analysis of simultaneous demand and supply’, Quantitative Marketing and Economics 1. Jiang, R., P. Manchanda, and P. Rossi (2009), ‘Bayesian analysis of random coefficient logit models using aggregate data’, Journal of Econometrics149(2).