Download
1 / 23
230 likes | 239 Views
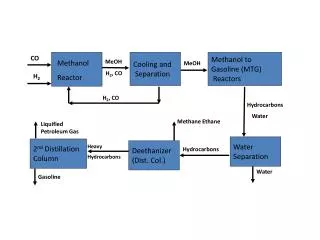
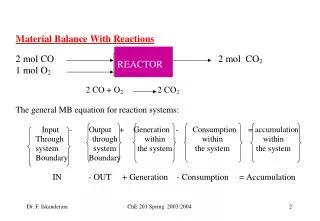
Reactor Economics 2007. Jim Harding California Senate Energy Committee Hearing December 10, 2007 San Diego. Key Developments. Near certain carbon controls Persistently high fossil fuel prices Growing government subsidies for non-carbon resources Possible loan guarantees

E N D
Reactor Economics 2007 Jim Harding California Senate Energy Committee Hearing December 10, 2007 San Diego
Key Developments • Near certain carbon controls • Persistently high fossil fuel prices • Growing government subsidies for non-carbon resources • Possible loan guarantees • Possible production tax credits • The “China Effect” – concrete, steel, copper – up substantially since 2002 • Nuclear supply chain moribund for two decades • Electric industry restructuring • Less certain cost recovery • Transmission bottlenecks and lead time
Beware Old Studies, Particularly for Nuclear Power • Studies • GE/Westinghouse ($1000-1500/kW) • University of Chicago ($1500/kW) • World Nuclear Association ($1000-1500/kW) • US Energy Information Administration ($2083/kW) • Newer analyses disagree – S&P ($4000/kW), Florida Power and Light, Keystone report ($3600-4000/kW), Moody’s ($5000/kW)
US Projections – Decades Ago Mark Gielecki and James Hewlett, Commercial Nuclear Power in the United States: Problems and Prospects, US Energy Information Administration, August 1994. Data is in 2002 dollars.
US Economics – Two Decades Ago Koomey, Jonathan, and Nate Hultman. 2007. “A Reactor-Level Analysis of Busbar Costs for US nuclear plants,” 1970-2005, forthcoming in Energy Policy
Recent Japanese Experience Cost data from MIT 2003 Future of Nuclear Power study. Average does not include South Korean units.
Escalation Likely Worse for Nuclear • Industry moribund in Western Europe, US, and Russia since TMI and Chernobyl • Twenty years ago (US): 400 suppliers, 900 N-Stamp holders; today 80 and 200 • Only one forge for large parts – Japan Steel Works; maybe Creusot Forge (France) • Skilled labor and contractor limits • Uranium production well below current consumption
Lifecycle Costs Costs are in real discounted 2007 cents/kWh
Tom Neff (MIT), Uranium and Enrichment: Enough Fuel for the Nuclear Renaissance?, December 2006.
Jeff Combs, President, Ux Consulting Company, Price Expectations and Price Formation, presentation to Nuclear Energy Institute International Uranium Fuel Seminar 2006
Efficiency and Renewables are Disruptive Technologies A disruptive technology is often cheaper than the operating cost of the existing system Demand is not limited to growth in service Efficiency resources cost less thanoperating costs for existing gas (or coal with carbon taxes); they pay for themselves with +3x more carbon savings per dollar Wind was disruptive from 2002-2005 and may be again Photovoltaics may soon become one Only disruptive energy technologies can grow fast enough to solve climate challenges
Codes, Standards, and Programs Are Also Needed Northwest Power Planning Council, Achievable Savings, August 2007
Historical Northwest Utility Programs Northwest Power Planning Council, Achievable Savings, August 2007
Figure 8 -Estimated ENERGY STAR CFL Market Share for the Northwest and U.S., 2000-2006 • Sources: NW CFL sales 2000-2006: PECI and Fluid Market Strategies sales data reports; and NEEA estimate of an additional 1.5 million WAL-MART CFLs sold region-wide in 2006 (See Appendix A [Section 9.1.1] of MPER3 for more detail); U.S. and NW population estimates 2000-2006: U.S. Census 2004; U.S. market shares and non-CFL sales 2000-2005: Itron California Lamp Report (2006); U.S. market share 2006: D&R International (personal communication). Compact Fluorescent Market Penetration
The Bottom Line • Twenty years from light water reactor technology will be roughly the same as it is today • Efficiency resources, wind turbine technology, and photovoltaics are improving rapidly • Take one example --- Nanosolar • started by the Google founders, backed also by Swiss Re • Building two 430 MW/yr thin film PV production facilities this year in Germany and California, using a technology they equate to printing newspapers • Target price is $0.50/peak watt --- cheaper than delivered electricity price in most parts of the world • The cheapest, least risk strategy is rapid development of efficiency resources