Download
1 / 19
190 likes | 195 Views
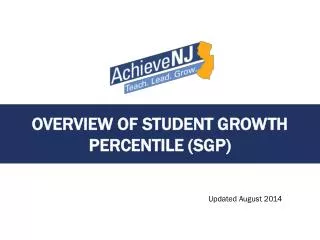
Learn about Student Growth Percentiles (SGPs) and how they measure student progress compared to peers in grades 4-8 Language Arts and 4-7 Math in New Jersey. Discover the timeline of SGP development and how SGPs are used in evaluations and school performance reports.

E N D
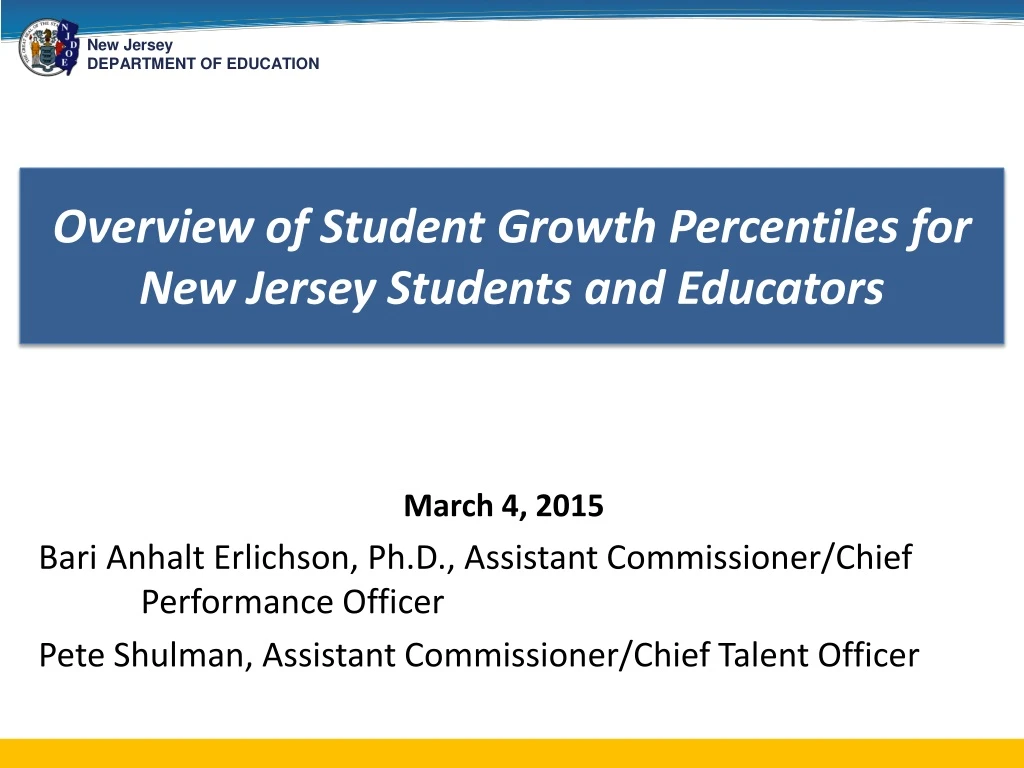
Overview of Student Growth Percentiles for New Jersey Students and Educators March 4, 2015 Bari Anhalt Erlichson, Ph.D., Assistant Commissioner/Chief Performance Officer Pete Shulman, Assistant Commissioner/Chief Talent Officer
What is SGP? Student Growth Percentiles (SGPs) measure how much a student has progressed from one year to the next compared to peers with similar academic history from across the state in 4th-8th grade Language Arts and 4th-7th* grade Math. All students can show growth. *For 2014-15, SGP does not apply to 8th-grade math teachers.
SGP Development Timeline Federal Mandate for Stimulus Funds: States Must Calculate “Student Growth”; Link Teachers to Students District SGP Profile Reports Deployed via NJ SMART A thoughtful, multi-year approach to ensure data is accurate and usable. 2012-13 Teacher mSGP Reports Provided to All Districts for Learning Purposes and Data Preview Evaluation Pilot Advisory Committee Provides Feedback on Usefulness of SGP Data Student SGPs Provided to All Districts in NJ SMART 2013-14 mSGP Score Verification & Certification Process Completed by Districts 2011-12 Teacher Median SGP (mSGP) Reports Provided to Pilot Districts for Learning Purposes 2015 2010 2012 2013 2011 2014 NJ Adopts SGP Methodology for Calculating Student Growth SGP Training Begins for Districts; SGP Video Released TEACHNJ Act Passed; Growth Measures Required for Evaluation School SGPs Used in School Performance Reports per NJ’s Federal ESEA Waiver 2013-14 Teacher & Principal mSGP Reports Provided to All Districts for Use in Evaluations; Score Verification Process Announced
Growth, not Proficiency 250 Effective teaching results in learning growth which can go unnoticed if only looking at proficiency; SGP is one of multiple measures to focus on growth. Advanced Proficient 220 230 205 Maria NJ ASK Scale 200 Proficient 165 160 Albert 150 100 Partially Proficient Gr. 3 Gr. 4 Gr. 5 NJ ASK Scale Score by Grade
Calculating SGP • Albert has taken the 5th grade NJ ASK. How does his score compare to those of his academic peers? Academic Peers’ Prior Scores Albert’s Prior Scores
Calculating SGP • Albert scored 165. His academic peers scored between 110 and 200. How did Albert do in comparison to them? Advanced Proficient 250 Albert’s 5th Grade NJ ASK Score Albert’s Academic Peers’ NJ ASK Scores Advanced Proficient 250 200 Proficient 200 160 150 Proficient 200 NJ ASK Score 110 Partially Proficient 100 160 29% 165 Gr.3 Gr.4 Gr.5 150 70% Partially Proficient 100 Gr.3 Gr.4 Gr.5
Calculating SGP • A comparison to his academic peers allows us to see that Albert actually outperformed 70% of students who, up until this year, performed in a similar manner to Albert. Albert’s Score Academic Peers’ Scores • SGP 1% 99% 70%
SGP calculation 3rd 4th
SGP calculation SGP = 50 3rd 4th
SGP calculation SGP = 50 SGP = 50 3rd 4th
SGP calculation SGP = 50 SGP = 50 SGP = 50 3rd 4th
SGP calculation SGP = 50 SGP = 50 SGP = 50 7th 8th
SGP calculation SGP = 50 SGP = 50 SGP = 50 4th 5th
Calculating Median SGP (mSGP) for Educators • Albert’s SGP along with the SGPs of all his teacher’s students are arranged from low to high. Median SGP Score • Albert’s teacher receives a median SGP score of 51. Teachers qualify to receive the mSGP with at least 20 separate students in class at least 70% of the year before the test. 14
Converting mSGP to 1-4 Evaluation Score • Based on her mSGP score, Albert’s teacher receives an mSGP evaluation rating of 3. This is combined with other evaluation components in a summative rating.
mSGP Weights in Teacher Evaluations 2014-2015
mSGP Weights in Principal Evaluations 2013-2014 2014-2015 All SGP Principals/ APs/VPs
Release of 2013-14 mSGP Scores All districts received secure access to their 2013-14 teacher and principal/AP/VP Median Student Growth Percentile (mSGP) data on January 8, 2015. • NJDOE has worked with NJ educators in taking a long and thoughtful approach to implementing both evaluations and mSGP. • mSGP data is an important part, but only one part of an educator’s evaluation. These scores will be used to finalize 2013-14 evaluations and to inform educators’ ongoing professional development. • About 15% of teachers and 60% of principals/APs/VPs received 2013-14 mSGP scores. • A dry run for teacher mSGP data was conducted last year to improve data quality; if educators identify a problem with the 2013-14 mSGP score, the Department is offering options for addressing the issue. By statute, mSGPs (like all aspects of an individual’s evaluation) are confidential and should not be shared publicly.
Evaluation Score Certification • Districts have an opportunity to certify that all 2013-14 evaluation data is correct or to make changes where necessary. • On Feb. 3 the Department released the 2013-14 Evaluation Score Certification Tool, a new electronic application for districts to use in certifying final 2013-14 summative ratings for all educators. • This interface allowed districts to review data, correct any errors that occurred in the original NJ SMART submission, and certify the accuracy of each staff member’s final score. • Districts have been given until March 13 to complete the certification process.