Download
1 / 10
100 likes | 203 Views
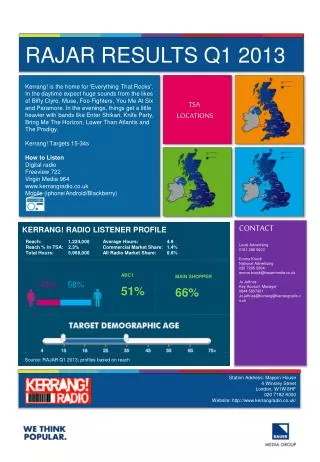
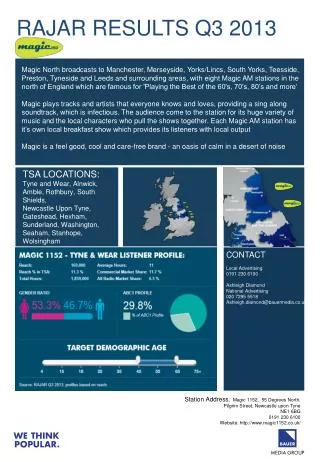
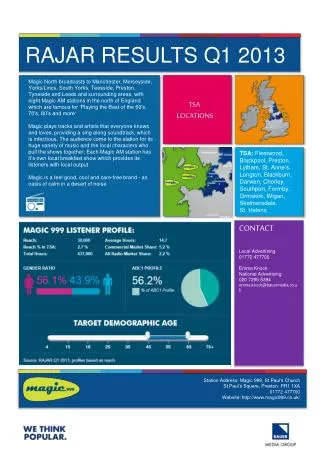
Kiss 105-108 Q1 2013 Rajar Results. Key Highlights – Qtr1 2013 . Kiss 105-108 is commercial market leader, now reaching 476,000 listeners each week – up 4 % QoQ and 2% YoY Kiss’ market share is 7.7%

E N D
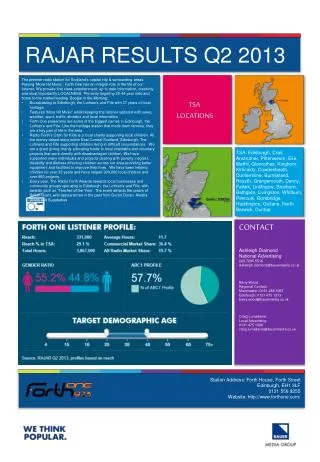
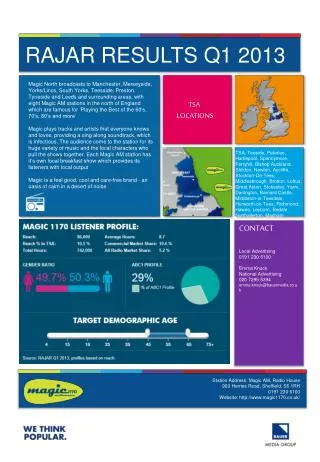
Key Highlights – Qtr1 2013 Kiss 105-108 is commercial market leader, now reaching 476,000listeners each week – up 4% QoQ and 2% YoY Kiss’ market share is 7.7% On average a Kiss listener tunes into the station 7.6 hours each week, equating to a total of 3.6mhours listened each week Kiss reaches 338,000 Housewives and 220,000ABC1 listeners each week Kiss is number one for reach and share in the commercial market amongst 15-24s, 15-34s and 15-44s 15-34s are our strongest audiencein which we reach 313,000 with a market share of 22.8% Breakfast remains commercial leader with 237,000, up 7% QoQ and 9% YoY Drive remains the number one commercial show in the region with 265,000 listeners Kiss 105 is part of KISS UK which reaches 4.1 million adults across the UK Source: Rajar Qtr1 2013
Kiss 105:Demographic Profile 45+ 35-44 Female C2DE 25-34 Male ABC1 15-24 Source: Rajar Qtr1 2013
Weekly reach All Adults: Kiss vs. other stations in its TSA Source: Rajar Qtr1 2013 * = Station TSA doesn’t cover all of Kiss TSA All stations on half yearly reporting period apart from KLFM and Star which are yearly 000s 000S Source: Rajar Qtr1 2013
Market Share All Adults: Kiss vs. other stations in its TSA Source: Rajar Qtr1 2013 * = Station TSA doesn’t cover all of Kiss TSA All stations on half yearly reporting period apart from KLFM and Star which are yearly % 000S Source: Rajar Qtr1 2013
Weekly reach 15-34: Kiss vs. other stations in its TSA Source: Rajar Qtr1 2013 * = Station TSA doesn’t cover all of Kiss TSA All stations on half yearly reporting period apart from KLFM and Star which are yearly 000s 000S Source: Rajar Qtr1 2013
Market Share 15-34: Kiss vs. other stations in its TSA Source: Rajar Qtr1 2013 * = Station TSA doesn’t cover all of Kiss TSA All stations on half yearly reporting period apart from KLFM and Star which are yearly % 000S Source: Rajar Qtr1 2013
Weekly reach 15-44: Kiss vs. other stations in its TSA Source: Rajar Qtr1 2013 * = Station TSA doesn’t cover all of Kiss TSA All stations on half yearly reporting period apart from KLFM and Star which are yearly 000s 000S Source: Rajar Qtr1 2013
Market Share 15-44: Kiss vs. other stations in its TSA Source: Rajar Qtr1 2013 * = Station TSA doesn’t cover all of Kiss TSA All stations on half yearly reporting period apart from KLFM and Star which are yearly % 000S Source: Rajar Qtr1 2013