Download
1 / 20
200 likes | 298 Views
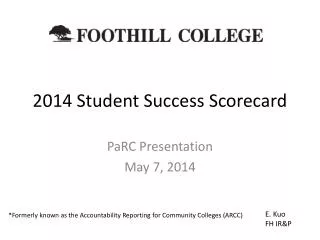
FOOTHILL COLLEGE. Student Success Scorecard. PaRC Presentation April 17, 2013. E. Kuo FH IR&P. *Formerly known as the Accountability Reporting for Community Colleges (ARCC). Overview. Annual scorecard with specific metrics related to student progress and success

E N D
FOOTHILL COLLEGE Student Success Scorecard PaRC Presentation April 17, 2013 E. Kuo FH IR&P *Formerly known as the Accountability Reporting for Community Colleges (ARCC)
Overview • Annual scorecard with specific metrics related to student progress and success • Framework based on Student Success Taskforce (SSTF) recommendations • Disaggregation of data • Longitudinal data FOOTHILL COLLEGE
College Profile Over half of 2011-12 students are between ages 20 to 49 FT Faculty based on district figures Asians, Hispanics and Whites compose over three-fourths of students enrolled FOOTHILL COLLEGE
College Indicators • Tracking students over six years • Scorecard focuses on 2006-07 cohort • Data available for five cohorts • 2002-03 to 2006-07 FOOTHILL COLLEGE
Completion Foothill Prepared State Prepared Foothill Overall Foothill Unprepared State Overall State Unprepared Prepared/Unprepared determined by lowest attempted Math or English course FOOTHILL COLLEGE
Completion Peer Grouping Overall Completion Rates Peer Group average: 55% Peer group high: 65% Peer Group low: 47% FOOTHILL COLLEGE
Persistence State Unprepared Stateoverall Foothill Overall State Prepared Foothill Prepared Foothill Unprepared Foothill reports lower persistence rates when compared to state figures About one-third of Foothill completers did not persist FOOTHILL COLLEGE
Attain 30 Units Foothill Prepared Foothill Overall FH Unprepared State Prepared State Overall State Unprepared Foothill’s cohorts tend to attain 30 units at a higher rate when compared to state figures Prepared students attain 30 units at a higher rate compared to those Unprepared FOOTHILL COLLEGE
Who’s being counted? • Completion, Persistence and Attain 30 Units cohort definition: • First-time students (w/valid SSN) • 6 units minimum earned (pass course) • Attempt any Math or English in first three years • Foothill 2006-07 cohort: 958 students • 47% Female (451) • 85% Under age 20 (813) • 39% Whites (373) • 25% Asian (239) • 16% Latino/a (157) Foothill had 2,054 new first-time students in 2006-07 academic year FOOTHILL COLLEGE
What outcomes are counted? • Completion cohort outcomes definition: • Earned AA/AS • Earned Certificate • Transfer to four-year institution • At least 60 transferrable CSU/UC units with minimum 2.0 GPA • Within 6 years FOOTHILL COLLEGE
What outcomes are counted? • Persistence cohort outcomes definition: • Enroll in four consecutive quarters • Within the first year of enrollment • Attain 30 Units cohort outcomes definition: • Earned at least 30 units • Within 6 years FOOTHILL COLLEGE
Basic Skills Education Progress • Who’s in the cohort? • Attempt a credit course below transfer level • What’s the cohort outcome? • Math: pass a college-level Math course within 6 years (includes degree and transfer applicable) • English: pass a college-level English course within 6 years • ESL: pass the ESL sequence or a college-level English within 6 years FOOTHILL COLLEGE
Math FH Filipino FH White State FH Asian FH Latino Foothill FH African American Who’s being counted at FH in 2006-07? What’s being counted in 2006-07? 29 African Americans 17 Filipinos Mainly Math My Way Over 40% of cohort 281 Whites 16 Asians 87 Latino/as Total 281 Cohort size decreased from a high of 424 students in 2002-03 FOOTHILL COLLEGE
English What’s being counted at FH in 2006-07? Mainly English 100 as well as 104 A/B, 205 and 215 FH White FH Filipino FH Latino Foothill FH African American FH Asian State Cohort size has decreased steadily from 905 in 2002-03 Who’s being counted at FH in 2006-07? 55 African Americans 52 Asians 25 Pacific Islanders 26 Filipinos 142 Latino/as Total 500 157 Whites FOOTHILL COLLEGE
ESLL ESL cohort size has decreased from a high of 578 in 2002-03 Who’s being counted at FH in 2006-07? 4 African American 52 White 2 Filipino & 2 PI 148 Asian 134 Latino/a Total 365 FH Asian Foothill FH Latino/a State What’s being counted at FH in 2006-07? Seems like about 45% in F06 are enrolled in ESL 166/167, 155/156 FOOTHILL COLLEGE
Career Technical Education 59 African Americans Total 1947 Who’s being counted at FH in 2006-07? 518 Asians 801 Whites 82 Filipinos 23 Pacific Islanders 255 Latino/as State Foothill FOOTHILL COLLEGE
Who’s in the cohort? • First-time CTE course completers who also complete 8+ units in the subsequent 3 years in a single vocational discipline What’s the cohort outcome? • Earned AA/AS • Earned Certificate • Transfer to a 4-yr institution • At least 60 transferrable CSU/UC units with minimum 2.0 GPA • Within 6 years FOOTHILL COLLEGE
What’s the message? • System-level: • Emphasis on defining completion as degree/certificate and transfer attainment • Different outcomes among Prepared and Unprepared students • Institution-level: • Decrease in cohort size over time • Disaggregating data can lead to small groups of students • Changes in courses (number and curriculum) affects what is included in the cohort • How are we serving our students? FOOTHILL COLLEGE
What’s the next step? • How is this information useful to us? • Use data to set institutional priorities in planning and resource allocation process • Revisit institutional goals, objectives and metrics • Present more detailed Scorecard data in other settings such as core mission groups FOOTHILL COLLEGE
Check it out! • Student Success Scorecard http://scorecard.cccco.edu http://www.foothill.edu FOOTHILL COLLEGE