Download
1 / 13
130 likes | 261 Views
Mapping Surface NO 2 and PM 2.5 from Satellite Observations. Randall Martin, Dalhousie University with contributions from Aaron van Donkelaar , Dalhousie U Lok Lamsal , Dalhousie U NASA Goddard Colin Lee, U Toronto Dalhousie U. Environment Canada, Downsview 16 Jan 2011.

E N D
Mapping Surface NO2 and PM2.5 from Satellite Observations Randall Martin, Dalhousie University with contributions from Aaron van Donkelaar, Dalhousie U LokLamsal, Dalhousie U NASA Goddard Colin Lee, U Toronto Dalhousie U Environment Canada, Downsview 16 Jan 2011
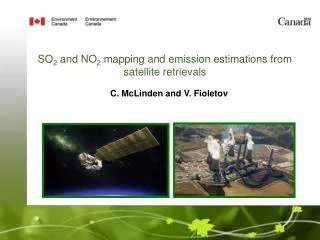
Major Nadir-viewing Space-based Measurements of Air Quality (Not Exhaustive) Solar Backscatter&Thermal Infrared
In Situ Model General Approach to Estimate Surface NO2 Concentration Method: Solar backscatter NO2 Column Model Profile l1 l2 Scattering by Earth surface and atmosphere Idealized NO2 absorption spectrum • S→ Surface Concentration • Ω → Tropospheric column l1 l2
Afternoon Ground-Level NO2 Inferred From OMI for 2005-2007 NO2 [ppbv] LokLamsal
Ground-Level NO2 Inferred From OMI for 2005 Works in Near-Real-Time! Values Estimated Using Monthly NO2 Profiles for Different Year (2006) Temporal Correlation with In Situ Over 2005 ×In situ —— OMI Insignificant change in results if profiles are daily coincident values from 2005 Lok Lamsal
Infer Ground-level NO2 Between Monitors Using Empirical Column-to-Surface Ratio from In Situ MonitorsAutomatically Corrects for Bias in Satellite Column Passive Sites Permanent Sites Lee et al., ACP, 2011
Combine both information sources (Model and In Situ)Explore with PM2.5 inferred from MODIS & MISR AOD
RAW Has Significant Agreement with Long-Term (2001-2006) In situ Measurements Annual Mean PM2.5 [μg/m3] (2001-2006) Satellite Derived Satellite-Derived [μg/m3] In-situ In-situ PM2.5 [μg/m3] van Donkelaar et al., EHP, 2010
Significant Association of Long-Term PM2.5 Exposure with Cardiovascular Mortality Crouse et al., EHP, submitted
RAW Has Limited Daily Skill Mean daily error can exceed 100%! Aaron van Donkelaar
Climatological Monitor Correction (CMC) to Correct Bias • Regress 90-day running comparisons • Make correction surface using IDW2 weighted average
CMC Improves Daily Accuracy • Reduces effects of climatological bias • Reduces mean daily error to 40-60% Aaron van Donkelaar
IDW Inverse Distance Weighting of Satellite Estimate Improves Skill by Reducing Spatial Noise • Regional mean daily error now ~40% Aaron van Donkelaar