Download
1 / 10
100 likes | 222 Views
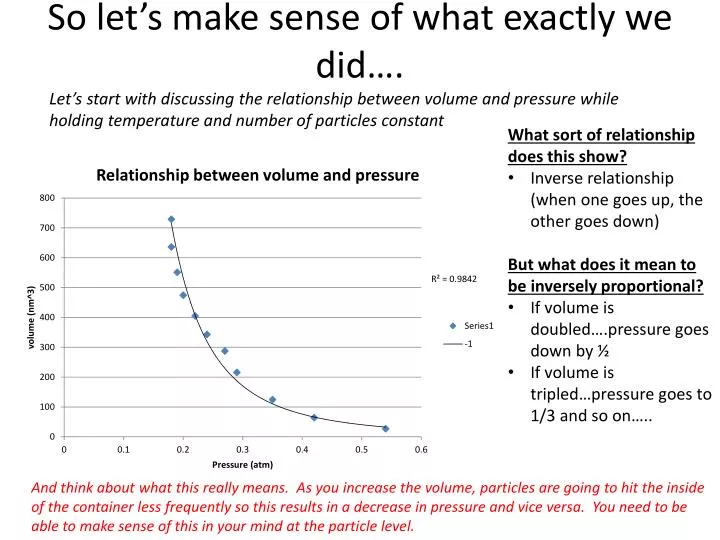
So let’s make sense of what exactly we did…. Let’s start with discussing the relationship between volume and pressure while holding temperature and number of particles constant. What sort of relationship does this show? Inverse relationship (when one goes up, the other goes down)

E N D
So let’s make sense of what exactly we did…. Let’s start with discussing the relationship between volume and pressure while holding temperature and number of particles constant • What sort of relationship does this show? • Inverse relationship (when one goes up, the other goes down) • But what does it mean to be inversely proportional? • If volume is doubled….pressure goes down by ½ • If volume is tripled…pressure goes to 1/3 and so on….. And think about what this really means. As you increase the volume, particles are going to hit the inside of the container less frequently so this results in a decrease in pressure and vice versa. You need to be able to make sense of this in your mind at the particle level.
Volume is decreased by a factor of ½ so the pressure doubled (inversely proportional) Boyle’s Law The pressure exerted by a gas is inversely proportional to the volume it occupies if the temperature and amount of gas remain constant within a closed system • The first person to do a systematic quantitative study of this volume-pressure relationship was the chemist Robert Boyle (1627-1691) • Boyle quantitatively determined the same relationship you did in your simulation. This relationship was named after him and so we call the relationship between pressure-volume Boyle’s Law • Let’s try to express this in a quantitative way by looking at the product of the initial V & P and the final V & P in the picture above • The products are the same!! • The product of V & P at any two sets of conditions is always constant at a given temperature Boyle’s Law
How about the relationship between pressure and temperature? • This sort of relationship may look much more familiar to us • Directly proportional • As one goes up, the other goes up and as one goes down, the other goes down • What does this mean quantitatively? • If temperature is doubled, then pressure is doubled • If temperature goes down by ½, then pressure goes down by ½ Again, actually think about what this means and if it makes sense: As you increase the temperature, you’re providing more and more energy to the particles. Because the particles have more energy, they move faster. If they move faster, they are going to collide with the inside of the container much more frequently and with greater force (increase in pressure) and vice versa Remember that the number of particles and volume are being held constant!
Let’s try to express this in a quantitative way by looking at the quotients of the values above in each case • The quotients are the same! This relationship was first demonstrated by the French chemist Joseph Gay-Lussac in 1802 The pressure of a gas is directly proportional to the Kelvin temperature if the volume and number of particles are held constant Gay-Lussac’s Law
There’s one more thing we need to consider about this relationship between pressure & temperature • Earlier, we stated that the pressure of a gas is directly proportional to the kelvin temperature if the volume and number of particles are held constant • What is this kelvin thing and can’t we just say the same thing for degrees Celsius? • NO WAYYYYYYYY!!!!!! And here’s why • It turns out that if we actually gather data in the same way we did in the simulation, but use the celsius temp. scale instead of the kelvin scale, we get the following graph • The relationship is linear, like we expected, but look where it starts! This doesn’t make any sense • How can there be some sort of pressure if there is no temperature? • It should start at the origin right?!?! P (atm) T (0 C) • It was well known in the 19th century that 0 0C was not the coldest temperature possible. After all, it’s only the freezing point of water. • They knew the relationship between temperature and particle motion (hot temp = faster motion & vice versa) but Gay-Lussac’s data suggested that in order for there to be no particle motion, temperature must be MUCH lower than O 0C • Thus started the hunt for the coldest temperature possible!!!
Hunt for the coldest temperature possible • There needed to be an absolute temperature scale and one that could better provide quantitative calculations for Guy-Lussac’s relationship • In 1848, Lord Kelvin wrote in his paper On an Absolute Thermometric Scale, of the need for a scale where “infinite cold” was the scale’s starting point P (atm) T (0 C) • It turns out that if we extrapolate (continue our graph) our data until there is 0 pressure, we arrive at a temperature of -273 0C • This was considered to be the coldest temperature possible and was therefore called absolute zero • From this, Lord Kelvin helped create the new absolute temperature scale where 0 K was the starting point (0 K = absolute zero) • At absolute zero, all particle motion is at its minimum vibration • The Kelvin degree is the same size as the Celsius degree but Celsius will always be 273 less than Kelvin!
Kelvin to Celsius • Because we rarely use a device that gives us temperature in Kelvin, we need to always convert celsius to Kelvin when calculating any of the gas laws • ALWAYS MAKE SURE YOUR TEMPERATURE IS IN KEVLIN BEFORE YOU DO YOUR CALCULATIONS!!!!!
Relationship between Volume & Temperature What sort of relationship do you think these 2 variables would have assuming we kept pressure and the number of particles constant? Think about what happens to particles if we increase or decrease temperature. Which of the following 2 graphs do you think best represents this relationship? V V T T
V • What do you think this temperature is in both K and Celsius? • 0 K • -273 0C T (K) • The relationship we see in this graph appears to be directly proportional • As T goes up, V goes up at the same rate and vice versa The scientist responsible for discovering this relationship between volume and temperature was Jacques Charles • Charles found that the volume of a constant number of particle is directly proportional to its Kelvin temperature if the pressure is kept constant • This is known as Charles’s law • Remember that in a directly proportional relationship, the quotient of the 2 variables will always be constant. Because of this, we are able to create the following equation: Charles’s law
Relationship between Volume & Number of Particles • Directly proportional relationship • As one goes up, the other goes up by the same factor and vice versa V • This relationship was first established by AmedeoAvagadro in 1811 • Hypothesized that 2 samples of a gas, at the same volume and at same temp and pressure, contain same number of particles # of particles Notice that even though the # of particles are the same in all the samples, each has a different mass due to different substances being involved You do not need to understand what the unit “mol” means yet. For now, simply consider it to be a unit for counting like how we use “dozen”