Download

1 / 28
280 likes | 373 Views
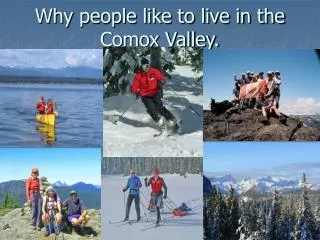
Our beautiful Comox Valley. 1986 to 2007. The best place on Earth facing serious challenges. Population more than doubled in the last 30 years Average annual increase 2.43%, that means 1650 more people and approx. 1000 more cars every year!.

E N D
1986 to 2007 The best place on Earth facing serious challenges. Population more than doubled in the last 30 years Average annual increase 2.43%, that means 1650 more people and approx. 1000 more cars every year!
Population growth = More cars = more traffic congestion = more cars sitting idling at intersections = more pollution and deterioration of our life style
Downtown Courtenay Do we have room for more cars?
COULD THIS BE PART OF THE SOLUTION? Bicycle Car Bus This shows that 50 people traveling by bus need the least amount of space for parking. 50 bicycles take less than half a tennis court , while cars, at 1.2 ppc, the best part of a football field.
We have to encourage more people to do their short trips by walking or cycling
WHAT WILL IT TAKE TO GET THIS ACCOMPLISHED? Less of this More of this
In a recent survey taken by the CV Cycling Coalition, more than 70% of the 653 respondents said that they found conditions for cycling in the valley too dangerous. 62% said that it was very likely that they would ride their bikes more often if improvements were made, while 33% said that it was somewhat likely that this would encourage them to ride more. 34% said that they would like to see more tax dollars spent on improvements for c/walking. While 65% were in favor of a significant increase in investment for safer and more convenient cycling and walking infrastructure.
VISION2 0 2 0 2 0 2 0 • IF WE START NOW TO INVEST 20% OF THE TRANSPORTATION BUDGET IN CYCLING INFRASTUCTURE…. • WE CAN REACH 20% OF CYCLING MODE SHARE…. • BY THE YEAR 2020
This would enable us to catch up to the increase in automobile traffic within 4 to 5 years, and start to graduallyreduce it from then on. This would be a win-win situation, as with every person riding a bike, there would be more room on the roads for people who have to drive.
Bikeways designed to get people out of their cars and onto bikes Valencia - Spain Innsbruck - Austria
Left turn priority for cyclists in Freiburg, Germany
If you build it (WELL) they will use it. Freiburg, Germany Walensee, Switzerland
Cycle path tunnel in Switzerland Great cycling/pedestrian path, suspended under the main bridge for autos.
Some bridges are safer for cycling than others Courtenay Slovenija
. But can we afford it?
Some people will say that building safe infrastructure for cycling is too expensive...BUTit is a LOT less expensive than building more roads, bridges, traffic lights and parking for cars. Once bikeways are installed they are a lot cheaper to maintain than roads for cars.
New traffic lights at 26th and Kilpatrick Instead of installing four more traffic lights, we could spend the 1 Million dollars they cost on improvements for cycling. This would in time stop the increase in the number of cars, and these lights will no longer be needed.
One of many possible paybacks Eliminated need for school busses. How much of a saving would that be? • Davis – California cycling mode share 17 % Huband Park Elem. School – It takes 6 busses and about 137 cars to get the students to and from school.
Benefits of other pay backs like cleaner air, less noise, less traffic congestion and a healthier life style are immeasurable.
Besides safer cycling routes, it will take education to get more people to cycle for transportation. We have to educate them how much they can do for their health, their pocket book and the environment by doing more trips by cycling or walking.- That it is not necessary to jump in the car to pick up a quart of milk at the corner store.- To consider riding their bike to the gym instead of driving there to jump on an exercise bike.-To consider cycling to work or to school. We will also teach cyclists how to ride their bikes safely.
While there are risks involved with cycling, most of them can be eliminated, or greatly reduced by knowing and following the rules of the road. • The majority of cycling accidents are caused by cyclists behaving unpredictably and irresponsibly on the road, and by not being visible to motorists. • Safe cycling courses will teach children and adults how to cycle responsibly and defensively in traffic to make cycling as safe as it can be.
Each one of us has to do their share to keep our air clean and our towns livable for our children and grandchildren