Download
1 / 50
500 likes | 517 Views
This workshop explores the use of geospatial tools in censuses, including building a geographic database, spatial analysis, and web-based mapping services. It also discusses the UN recommendations and integration of statistical and geospatial information.

E N D
Use of GIS, Spatial Analysis and Web-based Mapping United Nations Statistics Division United Nations Sub-regional Workshop on Collection and Dissemination of Socio-economic Data from Population and Housing Censuses New Delhi, India, 28-30 May, 2012
Outline • UN Recommendations/Census Geography Programme • Why we use geospatial tools in censuses • Building a EA Geographic Database • Spatial Analysis • Web-based Mapping Services and Applications • Handbook on Geospatial Infrastructure in Support of Census Activities United Nations Sub-regional Workshop on Collection and Dissemination of Socio-economic Data from Population and Housing Censuses New Delhi, India, 28-30 May, 2012
UN Recommendations • UN Principles and Recommendations for Population and Housing Censuses, Rev.2,recommended the use of Geospatial technologies for improving traditional methods of census mapping(adopted by UNSC in 2007). • Other recommendations derived from UN EGM on GIS and Census Mapping emphasized: • the need for countries to consider the census geography programme as a continuous process • the use of geospatial technologies and information is beneficial at all stages of population and housing census process (GI improves the efficiency in the preparatory, enumeration, processing and dissemination phases of the census) United Nations Sub-regional Workshop on Collection and Dissemination of Socio-economic Data from Population and Housing Censuses New Delhi, India, 28-30 May, 2012
Statistical Commission Decision on the Integration of Statistical and Geospatial Information Decision 41/110 (of the SC at its 41st session in 2010): • (b) Recognized the importance of the integration of geographic and statistical information and the opportunities provided in that context by the swift development of information technology, noting that national statistical offices are playing an increasing role in such integration, especially in the area of census management; • (c ) Called upon all national statistical offices to actively participate, in partnership with relevant national authorities, in the further development of national geographic information capacity in the context of spatial data infrastructures, taking full advantage of information technology and focusing special attention on the area of improving statistical and geographic metadata compatibility; United Nations Sub-regional Workshop on Collection and Dissemination of Socio-economic Data from Population and Housing Censuses New Delhi, India, 28-30 May, 2012
Census Cycle United Nations Sub-regional Workshop on Collection and Dissemination of Socio-economic Data from Population and Housing Censuses New Delhi, India, 28-30 May, 2012
GIS with Census mapping at all stages Pre-census Census Post-Census (Pre-enumeration) (Enumeration) (Post-enumeration) GPS/PDA GIS Digital Mapping GPS Photo/Video GIS Digital Mapping Satellite Imagery GIS Internet (Map-Server) EAs Units Administrative and Reporting Units United Nations Sub-regional Workshop on Collection and Dissemination of Socio-economic Data from Population and Housing Censuses New Delhi, India, 28-30 May, 2012
Administrative hierarchy • Every country has its own specific administrative hierarchy • Definition: A system by which the country and each lower level set of administrative units (except the lowest) are subdivided to form the next lower level. • Administrative areas for which census data will be reported United Nations Sub-regional Workshop on Collection and Dissemination of Socio-economic Data from Population and Housing Censuses New Delhi, India, 28-30 May, 2012
Illustration of a nested admin.Hierarchy • Relationships among all types of administrative and reporting unit boundaries are defined. • hierarchical levels may have actual administrative roles • Other units may have statistical roles alone United Nations Sub-regional Workshop on Collection and Dissemination of Socio-economic Data from Population and Housing Censuses New Delhi, India, 28-30 May, 2012
Coding Scheme • EA: a basic geographic feature • Need for an identifier: linking the geographic feature to the census data (attributes) recorded for them • EAs and administrative units: coding scheme • A unique code assigned to each EA, used in data processing • Coding scheme: scalability, flexibility, intuitiveness, compatibility • Example of a hierarchical coding scheme 1 2 0 3 2 4 4 0 1 2 0 0 5 Enumeration area district locality province United Nations Sub-regional Workshop on Collection and Dissemination of Socio-economic Data from Population and Housing Censuses New Delhi, India, 28-30 May, 2012
Geocode • Any alphanumeric or numeric-only value that will uniquely identify one and only one geographical entity within the set of all similar entities • Examples: • Mailing address • First and second level administrative areas with their name or number • Census statistical area numbers • Health district number • Watershed ID • Etc. • Geo-coding: not limited to address-matching (commercial use) Source: US Census Bureau United Nations Sub-regional Workshop on Collection and Dissemination of Socio-economic Data from Population and Housing Censuses New Delhi, India, 28-30 May, 2012
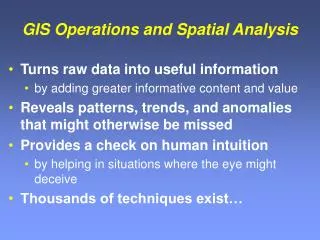
Why is GIS unique? • Can combine spatial and non-spatial data from different datasets in a spatial analysis operation in order to answer questions such as: • What is there… Identification • Where is… Location • What has changed since… Trends • What relationships exist between… Patterns • What is the best route between… Optimal path • What if… Model Source: US Census Bureau United Nations Sub-regional Workshop on Collection and Dissemination of Socio-economic Data from Population and Housing Censuses New Delhi, India, 28-30 May, 2012
A GIS Works on Geocoded Data GIS Maps, tables, reports Statistical Data Geographical Data Geocodes United Nations Sub-regional Workshop on Collection and Dissemination of Socio-economic Data from Population and Housing Censuses New Delhi, India, 28-30 May, 2012
Complete EA map with all components overlaid on one map display Main components are: Street network, Buildings EA boundaries layer Annotation, Symbols, Labels Building numbers Neatlines Legend United Nations Sub-regional Workshop on Collection and Dissemination of Socio-economic Data from Population and Housing Censuses New Delhi, India, 28-30 May, 2012
Components of a Hypothetical urban EA map United Nations Sub-regional Workshop on Collection and Dissemination of Socio-economic Data from Population and Housing Censuses New Delhi, India, 28-30 May, 2012
Entity-Relationship Example: EA entity can be linked to the entity crew leader area. The table for this entity could have attributes such as the name of the crew leader, the regional office responsible, contact information, and the crew leader code (CL code) as primary code, which is also present in the EA entity. R 1-1 1-N United Nations Sub-regional Workshop on Collection and Dissemination of Socio-economic Data from Population and Housing Censuses New Delhi, India, 28-30 May, 2012
Implementation of an EA database • : Example of an entity table – enumeration area United Nations Sub-regional Workshop on Collection and Dissemination of Socio-economic Data from Population and Housing Censuses New Delhi, India, 28-30 May, 2012
Components of a digital geographic census database United Nations Sub-regional Workshop on Collection and Dissemination of Socio-economic Data from Population and Housing Censuses New Delhi, India, 28-30 May, 2012
Spatial Analysis • Geographical features (Conceptual Model) • Components selection • Attributes • Structure • Spatial Relationships (explicit -Topolgy) • Spatial Analysis United Nations Sub-regional Workshop on Collection and Dissemination of Socio-economic Data from Population and Housing Censuses New Delhi, India, 28-30 May, 2012
Spatial relationships United Nations Sub-regional Workshop on Collection and Dissemination of Socio-economic Data from Population and Housing Censuses New Delhi, India, 28-30 May, 2012 • Logical connections between spatial objects represented by points, lines and polygons: - point-in-polygon - line-line - polygon-polygon • Spatial relationships: - “adjacent to”; - “connected to” - “near to”; - “intersects with” - “within”; - “overlaps” - etc.
Spatial Analysis Techniques • Techniques include: queries, distance measurements, buffering, linear interpolation, point pattern analysis, and cartograms, etc. • the main use of spatial analysis is for census products and services United Nations Sub-regional Workshop on Collection and Dissemination of Socio-economic Data from Population and Housing Censuses New Delhi, India, 28-30 May, 2012
Spatial Query United Nations Sub-regional Workshop on Collection and Dissemination of Socio-economic Data from Population and Housing Censuses New Delhi, India, 28-30 May, 2012 • select features by their attributes: • “find all districts with literacy rates < 60%” • select features by geographic relationships • “find all family planning clinics within this district” • combined attributes/geographic queries • “find all villages within 10km of a health facility that have high child mortality” Query operations are based on the SQL (Structured Query Language) concept
Examples: What is at…? Features that meet a set of criteria United Nations Sub-regional Workshop on Collection and Dissemination of Socio-economic Data from Population and Housing Censuses New Delhi, India, 28-30 May, 2012
Identification of a set of areas United Nations Sub-regional Workshop on Collection and Dissemination of Socio-economic Data from Population and Housing Censuses New Delhi, India, 28-30 May, 2012
United Nations Sub-regional Workshop on Collection and Dissemination of Socio-economic Data from Population and Housing Censuses New Delhi, India, 28-30 May, 2012
“is nearest to” • Point/point • Which family planning clinic is closest to the village? • Point/line • Which road is nearest to the village • Same with other combinations of spatial features United Nations Sub-regional Workshop on Collection and Dissemination of Socio-economic Data from Population and Housing Censuses New Delhi, India, 28-30 May, 2012
Travelling the Distance: A GPS-based Study of the Access to Birth Registration Services in Latin America and the Caribbean • Inter-American Development, March 2012 • Using GPS-collected data, the study examines how the distance from households to civil registries affects the probability of birth registration of children aged 0 to 4 (Countries: Bolivia, Dominican Republic and Peru) • Confirmation: Distance and location are crucial determinants of many households’ decisions: • Example of results: increasing the distance to the nearest registry office by 25 km is associated with a 4 percentage point increase in the probability of not registering a child’s birth in Bolivia, and 12 percentage points in the Dominican Republic. • Link:http://idbdocs.iadb.org/wsdocs/getdocument.aspx?docnum=36749514 United Nations Sub-regional Workshop on Collection and Dissemination of Socio-economic Data from Population and Housing Censuses New Delhi, India, 28-30 May, 2012
“is near to”: Buffer Operations • Point buffer • Affected area around a Hospital • Catchement area of a water source United Nations Sub-regional Workshop on Collection and Dissemination of Socio-economic Data from Population and Housing Censuses New Delhi, India, 28-30 May, 2012
Buffer Operations… • Line buffer • How many people live near the polluted river? • What is the area impacted by highway noise? United Nations Sub-regional Workshop on Collection and Dissemination of Socio-economic Data from Population and Housing Censuses New Delhi, India, 28-30 May, 2012
Spatial Analysis Techniques • point-in-polygonanalysis • Determines whether a point lies inside or outside a polygon. • Can be used to compare geo-coded village centroids lying inside and outside hazardous areas such as tropical storm tracks or earthquake zones. • Polygon overlayanalysis • Involves comparison between the locations of two different polygonal data layers. • For example, the boundaries of two administrative districts could be compared to troubleshoot errors in the field enumeration process United Nations Sub-regional Workshop on Collection and Dissemination of Socio-economic Data from Population and Housing Censuses New Delhi, India, 28-30 May, 2012
“ is within”: point in polygon • Which of the cholera cases are within the containment area United Nations Sub-regional Workshop on Collection and Dissemination of Socio-economic Data from Population and Housing Censuses New Delhi, India, 28-30 May, 2012
Solution: “Point-in-Polygon” operation will identify for each point the EA area into which it falls and will attach the census data to the attribute record of that survey point. Problem: We may have a set of point coordinates representing clusters from a demographic survey and we would like to combine the survey information with data from the census that is available by enumeration areas. United Nations Sub-regional Workshop on Collection and Dissemination of Socio-economic Data from Population and Housing Censuses New Delhi, India, 28-30 May, 2012
Spatial aggregation United Nations Sub-regional Workshop on Collection and Dissemination of Socio-economic Data from Population and Housing Censuses New Delhi, India, 28-30 May, 2012 • Example of Spatial aggregation: • fusion of many provinces constituting an economic region
Spatial data transformation: interpolation Example: Based on a set of station precipitation surface estimates, we can create a raster surface that shows rainfall in the entire region 13.5 20.1 26.0 27.2 12.7 15.9 24.5 26.1 United Nations Sub-regional Workshop on Collection and Dissemination of Socio-economic Data from Population and Housing Censuses New Delhi, India, 28-30 May, 2012
Example of linear interpolation creating contours United Nations Sub-regional Workshop on Collection and Dissemination of Socio-economic Data from Population and Housing Censuses New Delhi, India, 28-30 May, 2012
Areas of influence • Commuting distances: daily commuters flow United Nations Sub-regional Workshop on Collection and Dissemination of Socio-economic Data from Population and Housing Censuses New Delhi, India, 28-30 May, 2012
Modelling: smoothing • Evolution of the population beetwen two censuses United Nations Sub-regional Workshop on Collection and Dissemination of Socio-economic Data from Population and Housing Censuses New Delhi, India, 28-30 May, 2012
Spatial Analysis Techniques: Cartograms • sometimes used to display census results • The areas of the original polygons are expanded or contracted based on their attribute values such as population size or voting habits United Nations Sub-regional Workshop on Collection and Dissemination of Socio-economic Data from Population and Housing Censuses New Delhi, India, 28-30 May, 2012
Location-allocation problems • Site selection • Optimal allocation • Multicriteria Analysis United Nations Sub-regional Workshop on Collection and Dissemination of Socio-economic Data from Population and Housing Censuses New Delhi, India, 28-30 May, 2012
Different Geographies • A geography for data collection: • EA level or even dwelling level • Another geography for data dissemination: • Aggregated level (confidentiality) United Nations Sub-regional Workshop on Collection and Dissemination of Socio-economic Data from Population and Housing Censuses New Delhi, India, 28-30 May, 2012
Uses of Graphs: Enriching the Understanding of GIS Data Sets • Exploratory Spatial Data Analysis • Linked Maps, Graphs & Tables • Dynamic Feature Selection • Animation • Visualization over Time United Nations Sub-regional Workshop on Collection and Dissemination of Socio-economic Data from Population and Housing Censuses New Delhi, India, 28-30 May, 2012
GIS capabilities: Visualization United Nations Sub-regional Workshop on Collection and Dissemination of Socio-economic Data from Population and Housing Censuses New Delhi, India, 28-30 May, 2012
Data Stores Clients Web Services KML/ SOAP KML/ SOAP Web Mapping Architecture (Ref. B. Dickinson) • Mapping applications are accessed through standard web technologies to meet the needs of a specific business process or user. United Nations Sub-regional Workshop on Collection and Dissemination of Socio-economic Data from Population and Housing Censuses New Delhi, India, 28-30 May, 2012
Web Map Services • A Web Map Service (WMS) is a standard protocol for serving georeferenced map images over the Internet that are generated by a map server using data from a GIS database. (developed by OGC) • WMS is a widely supported format for maps and GIS data accessed via the Internet and loaded into client side GIS software • Most GIS software support WMS • GIS APIs United Nations Sub-regional Workshop on Collection and Dissemination of Socio-economic Data from Population and Housing Censuses New Delhi, India, 28-30 May, 2012
Cont… • Client technology: from “dumb” mapping to “smart” mapping application - The overall trend for web-based mapping is with more highly interactive, user-driven client interfaces as well as the desire by the general internet user to see the underlying data as a 3D environment and not a 2D flat-earth map. • Server-technology: service-oriented architecture (SOA) and broad spatial capabilities United Nations Sub-regional Workshop on Collection and Dissemination of Socio-economic Data from Population and Housing Censuses New Delhi, India, 28-30 May, 2012
Dissemination: web service application United Nations Sub-regional Workshop on Collection and Dissemination of Socio-economic Data from Population and Housing Censuses New Delhi, India, 28-30 May, 2012 45
Digital Data Dissemination Strategy • The wide range of potential users of disaggregated census data means that the NSO needs to pursue a multi-leveled digital data dissemination strategy. • Broadly, we can distinguish between the following types of users: • Advanced GIS users • Computer literate users • Novice users United Nations Sub-regional Workshop on Collection and Dissemination of Socio-economic Data from Population and Housing Censuses New Delhi, India, 28-30 May, 2012
Handbook on Geospatial Infrastructurein Support of Census Activities - Audiences: managerial and technical http://unstats.un.org/unsd/demographic/standmeth/handbooks/default.htm - “Cook-book” to illustrate the role of geospatial technology in each step of the census process - Each country has to find its own best possible solution - Available in the six UN official languages United Nations Sub-regional Workshop on Collection and Dissemination of Socio-economic Data from Population and Housing Censuses New Delhi, India, 28-30 May, 2012
Conclusions • Geographic Database/Topology • Variety of techniques: buffering, overlay, modelling…: • Although spatial analysis is sometimes used during the enumeration phase (clustering, for example, can aid in identifying housing units to be canvassed), the main use of spatial analysis is for census products and services • GIS: Decision making tool • Web-based applications and services United Nations Sub-regional Workshop on Collection and Dissemination of Socio-economic Data from Population and Housing Censuses New Delhi, India, 28-30 May, 2012
…Conclusions • Consider the Census Geography Programme as a continuous process • Adapt best practices to suit specific census requirements • Partner with other stakeholders (the public and private sector) in order to • Build the NSDI • Work jointly on coding efforts • Produce value added products – higher demand for census data United Nations Sub-regional Workshop on Collection and Dissemination of Socio-economic Data from Population and Housing Censuses New Delhi, India, 28-30 May, 2012
THANK YOU! United Nations Sub-regional Workshop on Collection and Dissemination of Socio-economic Data from Population and Housing Censuses New Delhi, India, 28-30 May, 2012