Download
1 / 11
120 likes | 134 Views
SOCIAL CLASS AND POLITICAL SATISFACTION. POLI 134AA Spring 2012. QUESTIONS AND THEMES. Meanings of public opinion Support for system (not just government) Legitimation and consolidation Democracy in principle Present but moderate 55% support vs. 18% vs. 20% vs. 7%

E N D
SOCIAL CLASS AND POLITICAL SATISFACTION POLI 134AA Spring 2012
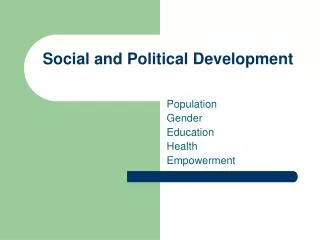
QUESTIONS AND THEMES • Meanings of public opinion • Support for system (not just government) • Legitimation and consolidation • Democracy in principle • Present but moderate • 55% support vs. 18% vs. 20% vs. 7% • Slight decline since 1997 • The relevance of social class • Concepts and measurements • Democracy in practice • Satisfaction • Ideology • Trust in institutions
SOCIAL CLASS AND PREFERENCE FOR DEMOCRACY, 2007 __________ Social Class _____________ Preference | Upper- Lower- for democracy Upper Middle Middle Lower ----------------------+--------------------------------------------+----------------------- Always preferable | 66.0 62.7 60.0 54.4 Authoritarianism maybe | 18.4 19.0 19.3 14.5 Doesn’t matter | 15.6 18.3 20.6 31.2 ----------------------+--------------------------------------------+---------------------- Total | 100.0 100.0 100.0 100.00
SOCIAL CLASS AND SATISFACTION WITH DEMOCRACY, 2007 __________ Social Class _______________ Satisfaction with | Upper- Lower- democracy | Upper Middle Middle Lower | ---------------------+--------------------------------------------+---------- Very satisfied | 16.8 8.6 8.5 6.4 Fairly satisfied | 34.9 31.6 31.2 25.4 Not very satisfied | 34.2 43.8 45.1 43.7 Not at satisfied | 14.2 16.0 15.2 24.6 | ---------------------+--------------------------------------------+---------- Total | 100.0 100.0 100.0 100.0
SOCIAL CLASS AND SATISFACTION WITH DEMOCRACY, 2007 ____________ Social Class_______________ Upper- Lower- Upper Upper Middle Middle Lower - Lower Argentina 37.5 33.9 32.7 28.1 + 9.4 Brazil 41.9 30.0 32.9 37.7 + 4.2 Colombia 40.9 34.6 37.2 32.9 + 8.0 Costa Rica 58.2 47.3 48.0 48.5 + 9.7 Dominican Republic 55.4 52.5 49.5 53.0 + 2.4 Ecuador 68.2 35.3 47.9 15.5 + 52.7 Honduras 45.0 29.6 31.8 32.8 + 12.8 Paraguay 23.5 9.8 6.4 8.3 + 15.2
CORRUPTION CONTROL AND SATISFACTION, 2007 Satisfaction | Progress in Reducing Corruption With democracy | Much Some Little None | ------------------+---------------------------------------- Very satisfied | 21.2 11.4 6.5 4.8 | Fairly satisfied | 31.9 38.6 28.8 17.8 | Not very satisfied | 34.2 39.0 49.2 46.0 | Not at all satisfied| 12.7 11.0 15.5 31.3 | ---------------------+------------------------------------- Totals | 100.0 100.0 100.0 100.0|
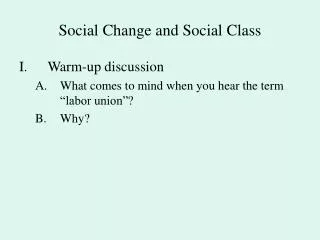
AND…? • Ambivalent commitment to democracy: • Instrumental or normative? • Social class bias: • Benefits for elites, not poor • Attitudes of “middle class” • Lack of confidence in leaders and institutions • Compatibility with “illiberal” democracy