Download
1 / 34
340 likes | 344 Views
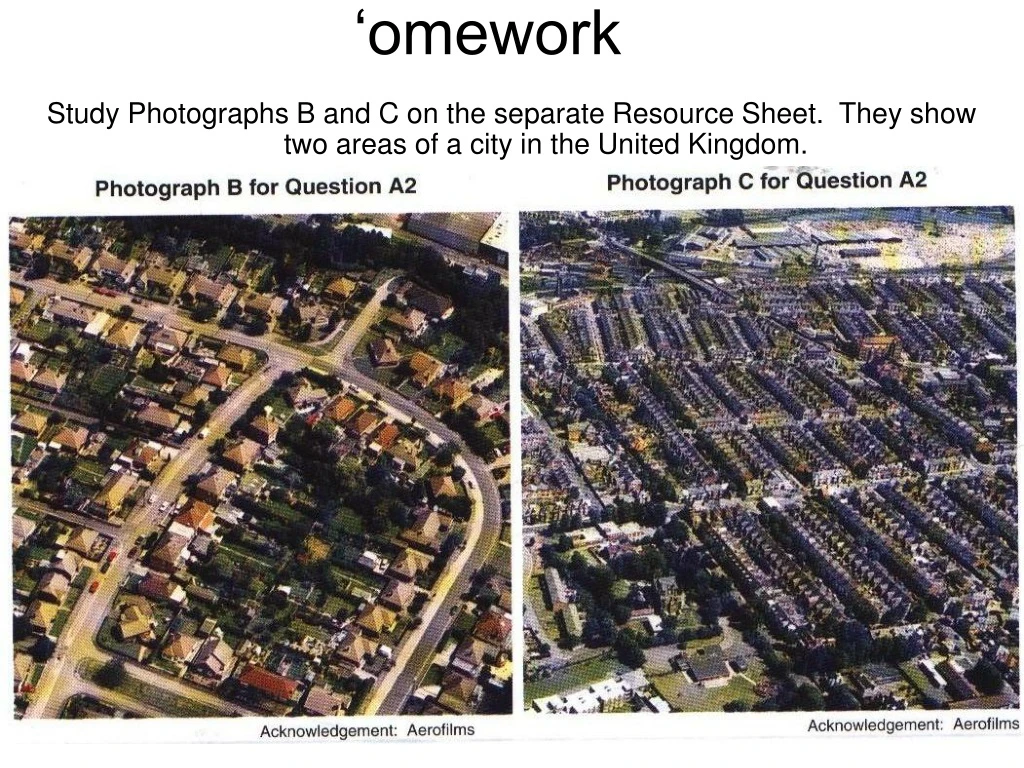
‘omework. Study Photographs B and C on the separate Resource Sheet. They show two areas of a city in the United Kingdom. Describe the type of housing and the housing layout in Photograph B. (2). Semi-detached or detached. Possibly bungalows. On curved, wide roads. Spaced out.

E N D
‘omework Study Photographs B and C on the separate Resource Sheet. They show two areas of a city in the United Kingdom.
Describe the type of housing and the housing layout in Photograph B. (2) • Semi-detached or detached. Possibly bungalows. • On curved, wide roads. • Spaced out. • Large gardens • Drives.
Compare these with Photograph C. (2) • Terraced • Housing is in rows • Cramped/compact/high density • Blocks • Narrow straight roads • No gardens or drives.
2 marks for the next question • All you need are any two of the following points. • Believe me there are loads. • But the question says use evidence so even if you get the idea right, if you don’t quote the figure you don’t get any marks. • And if you quote evidence but no impact (SO) then you don’t get any marks. • It’s simple but important.
Essentially for the muppets in the room • CAN YOU READ A GRAPH? • AND THEN CAN YOU THINK? • Together?
If you say talk about earning money and owning things e.g. cars when asked to talk about Quality of Life. Quality of life is how good your life is Standard of living is what you own So….. There are more professional people so they have a good wage ….is Standard of living. But….. There are more professional people in area 2 (40%) so they have a good wage WHICH means they have more to spend on leisure and entertainment, rent and food. ….is quality of life!
Describe the quality of life likely to exist in Area 1. Use evidence from the table. (2) 65% own their own home SO they have security. 5% rent from the council SO they could get evicted at any time. 10% rent privately SO they will not be able to make any improvements to their home that they may need e.g. decoration to make them happier.
Describe the quality of life likely to exist in Area 1. Use evidence from the table. (2) 32% of people are 0-14 SO there is likely to be more noise and vandalism. Because there are few older people (15%) they may find that the young people are too noisy and stressful.
Describe the quality of life likely to exist in Area 1. Use evidence from the table. (2) 52% of people do not own a car SO they may find it stressful and time consuming travelling to work and possibly more difficult to access some jobs. Because 52% of people do not own a car they may find it difficult to access services such as hospitals. Because 52% of people do not own a car they will not be stressed sitting in rush hour traffic.
Describe the quality of life likely to exist in Area 1. Use evidence from the table. (2) Because 42% are unskilled workers they will have a low wage SO this may mean they do not have a lot of money to spend on entertainment and leisure/food/rent/improving their home. Etc.
Describe the quality of life likely to exist in Area 1. Use evidence from the table. (2) Area 1 has 12% overcrowded SO the residents might find this stressful and there may be problems such as difficulty parking which is stressful or a lot of noise from traffic or children playing which is also stressful. This along with a high housing density could also mean that housing is cramped and people have little privacy. 16% of people do not have central heating so this means they are more likely to suffer ill health. It is only 1km from the CBD so is likely to suffer from congestion as people commute to and from work in the CBD. This would lead to noise and air pollution and can be stressful or lead to poor health.
Comparing stuff Older (43 compared to 33) Taller (5’11’’ compared to 5’9’’) Heavier (13 ish stones compared to more!) Hotter Richer (More money) Gorgeous WHEREAS appeals to fewer women.
How does this COMPARE to the quality of life likely to exist in Area 2. (4) • Area 2 has a higher rate of owner occupation (80% compared to 65%, or 15% higher) so people in area 2 will have more security.
How does this COMPARE to the quality of life likely to exist in Area 2. (4) • Area 2 has less children aged 0-14 (18% compared to 32% in area 1) so the area will be quieter and more peaceful/less stressful.
How does this COMPARE to the quality of life likely to exist in Area 2. (4) • Area 2 has a higher %age of people owning 1 car or more (70% - remember to add 1car and 2or more together – compared to 48% in area 1) SO people have better access to jobs and services which saves time and is more convenient.
How does this COMPARE to the quality of life likely to exist in Area 2. (4) • 40% of people in area 2 have professional/managerial jobs COMPARED to only 12% in area SO they are more likely to have money to spend on leisure and entertainment/food/enjoying themselves.
How does this COMPARE to the quality of life likely to exist in Area 2. (4) • Area 2 has only 1% overcrowded WHEREAS area 1 has 12%. This means that people will be more likely to be stressed in area 1 with more traffic, more noise and less privacy. • Area 2 has a lower %age of people with no central heating (5% compared to 16%) SO people are less likely to suffer ill health.
Suggest which photograph is of Area 1 and which of Area 2. Explain your choices. (4) • I think photo B is area 1 because my slippers are pink and they look like they might wear pink slippers in that photo. • I think that photo C is area 1 because the people in this photo will probably not have jobs because it is close to the CBD and as everyone knows THERE ARE NO JOBS HERE!!!!!!!
Suggest which photograph is of Area 1 and which of Area 2. Explain your choices. (4) • Photo B – detached/semis, Drives, large gardens, larger houses, spaced out. • Photo C – terraced, rows, cramped, narrow streets, lots more housing in a smaller area. • NOW Link this to the evidence.
What type of housing is more likely to be built by the council? In actual fact it is semi-detached. Most terraced housing is privately owned, especially in Sheffield although a lot of it is rented privately to students and young professionals. Very few terraced housing is council owned. BUT where you find terraced housing i.e. inner city you will also find flats and tower blocks which are council housing!
So Area 1 is more likely to be photo C because there is a lower rate of owner occupation (65%) and this is typical of an inner city terraced area. VICE VERSA (You don’t get the points for reversing an answer).
Photo B is more likely to be Area 2 (on the right) because there is a higher percentage of people 50 and over (34% compared to 15%) and this age group is more likely to be able to afford larger housing seen in photo B. VICE VERSA
Photo C is more likely to be Area 1 because there 52% of people do not have a car and this area has very little car parking whereas the housing in photo B has drives and area 2 has a high percentage of people who own 1 or more cars (70%) There are 4 marks here!
Photo B is more likely to be area 2 because there is very little overcrowding (1%) and the photograph shows that the housing is spaced out with large gardens, drives and wide roads. Photo B is area 2 because it is a typical suburb area with detached housing and area 2 is 4km from the CBD where you would find detached housing. Be careful using some of this info because you can only get 1 mark for some statements e.g. Photo B is area 2 because it has a low housing density and the housing here is spread out.
Suggest reasons why two different groups of people may wish to migrate away from the area shown on Photograph C. (2) • Elderly – to leave crime, noise, poor safety, overcrowding, small cramped housing with poor facilities e.g. no central heating. FOR more suitable housing e.g. old peoples homes or bungalows. • Families – for bigger gardens, more space, drive for family car, less air/noise pollution, less crime • Young professionals – for life in CBD where it is more entertaining, for bigger house if they are earning more money or planning to start a family.
Suggest ways in which the local council could improve the area shown in Photograph C to prevent people moving away. (6) • Tricky Dicky! • NOT HOUSING • Plus the council probably don’t own the housing because most terraced housing isn’t council.
Suggest ways in which the local council could improve the area shown in Photograph C to prevent people moving away. (6) • Roads – traffic calming, local resident permits, one way streets • WHY? • Less accidents so safer • Less noise pollution so less stressful • Less air pollution so less impact on health • Less traffic accidents so car owners are less worried about damage when parked on street.
Suggest ways in which the local council could improve the area shown in Photograph C to prevent people moving away. (6) • Green areas – parks, trees, flowers • WHY? • More space for families to play safely • More relaxing environment • Helps to reduce air pollution so less impact on health. • Increases pride in local area
Suggest ways in which the local council could improve the area shown in Photograph C to prevent people moving away. (6) • Improve education in the area • NOT build a school or build more. • What then? • Improve school environment to encourage better attendance. • Better school resources e.g. libraries to improve results • Support parents education so they can help their children e.g. book bags and parent guides • Training for parents to improve literacy/numeracy/ict to help children or to help them get a better job.
Suggest ways in which the local council could improve the area shown in Photograph C to prevent people moving away. (6) • Attract new businesses to the area • NOT build new businesses – the council can’t create a business out of nothing. • WHY? • Easier access for local people to get to jobs.
Suggest ways in which the local council could improve the area shown in Photograph C to prevent people moving away. (6) • Demolish old buildings (e.g. factories and housing) • The council can compulsorily purchase buildings and land if they are derelict and sell it on or develop it. • WHY? • Reduce overcrowding so more privacy and open space for people.
Should take about 30 minutes including reading time without a case study. • Should take 40 minutes with a case study. • Don’t write too much. • Don’t write too little. • I’m very good at spotting the difference between slackers and people who don’t understand it – write an answer even if you don’t get it because I (AND you) will learn more from your mistakes than if you don’t write anything.