Download
1 / 144
1.47k likes | 1.7k Views
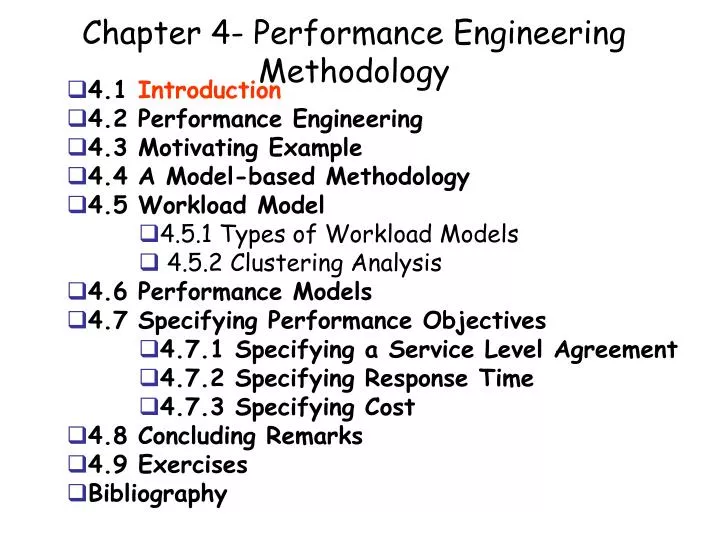
Chapter 4- Performance Engineering Methodology. 4.1 Introduction 4.2 Performance Engineering 4.3 Motivating Example 4.4 A Model-based Methodology 4.5 Workload Model 4.5.1 Types of Workload Models 4.5.2 Clustering Analysis 4.6 Performance Models 4.7 Specifying Performance Objectives

E N D
Chapter 4- Performance Engineering Methodology 4.1 Introduction 4.2 Performance Engineering 4.3 Motivating Example 4.4 A Model-based Methodology 4.5 Workload Model 4.5.1 Types of Workload Models 4.5.2 Clustering Analysis 4.6 Performance Models 4.7 Specifying Performance Objectives 4.7.1 Specifying a Service Level Agreement 4.7.2 Specifying Response Time 4.7.3 Specifying Cost 4.8 Concluding Remarks 4.9 Exercises Bibliography
Introduction(1) • Here is a central question: • how can one plan, • design, • develop, • deploy and • operate IT services that meet the ever increasing demands for • performance, • availability, • reliability, • security, • and cost?
Introduction(2) • Or, being more specific, is a given IT system properly designed and sized for a given load condition? • Can the insurance claims management system meet the performance requirement of subsecond response time? • Is the infrastructure of a government agency scalable and can it cope with the new online security policies required for financial transactions? • Can the security mechanisms be implemented without sacrificing user-perceived performance? • Is the reservations system for cruise lines able to respond to the anticipated peak of consumer inquiries that occurs after a TV advertisement campaign?
Introduction(3) • By breaking down the complexity of an IT system, one can analyze the functionality of each component, evaluate service requirements, and design and operate systems that will meet user's expectations. • In other words, the answer to the above questions requires a deep understanding of the system architecture and its infrastructure. • This chapter presents the basic steps of a methodology for performance engineering that are needed to fulfill the major performance needs of IT services.
Chapter 4- Performance Engineering Methodology 4.1 Introduction 4.2 Performance Engineering 4.3 Motivating Example 4.4 A Model-based Methodology 4.5 Workload Model 4.5.1 Types of Workload Models 4.5.2 Clustering Analysis 4.6 Performance Models 4.7 Specifying Performance Objectives 4.7.1 Specifying a Service Level Agreement 4.7.2 Specifying Response Time 4.7.3 Specifying Cost 4.8 Concluding Remarks 4.9 Exercises Bibliography
Performance Engineering(1) • It has been a common practice in many systems projects to consider performance requirements only at the final stages of the software development process. • As a consequence, many systems exhibit performance failures that lead to delays and financial losses to companies and users [25]. • Performance engineering analyzes the expected performance characteristics of a system during the different phases of its lifecycle. • Performance engineering • 1) develops practical strategies that help predict the level of performance a system can achieve
Performance Engineering(2) • 2) provides recommendations to realize the optimal performance level. • Both tasks rely on the following activities that form the basis of a methodology. • Understand the key factors that affect a system's performance. • Measure the system and understand its workload. • Develop and validate a workload model that captures the key characteristics of the actual workload. • Develop and validate an analytical model that accurately predicts the performance of the system. • Use the models to predict and optimize the performance of the system.
Performance Engineering(3) • Performance engineering can be viewed as a collection of methods for the support of the development of performance-oriented systems throughout the entire lifecycle [7]. • The phases of the system lifecycle define the workflow, procedures, actions, and techniques that are used by analysts to produce and maintain IT systems. • Figure 4.1 provides an overview of a performance-based methodology for system design and analysis. • This methodology is based on models that are used to provide QoS assurances to IT systems.
Performance Engineering(4) • These models are: • workload model, • performance model, • availability model, • reliability model, • and cost model. • At the early stages of a project, the information and data available to develop the models are approximate at best.
Performance Engineering(5) • For instance, in the requirement analysis stage, it is difficult to construct a detailed workload model, specifying the demands placed by transactions on the system's resources. • However, as the project evolves, more system information becomes available, reducing the error margin of the model's assumptions and increasing confidence in the estimated predictions of the future system's performance [23]. • In summary, the workload and performance models evolve side by side with the system project throughout the stages of its lifecycle. • Various types of workload and performance models can be used during the system lifecycle.
Performance Engineering(6) • Basically, they differ in three aspects: • complexity, • accuracy, • and cost. • Figure 4.1 illustrates the spectrum of the models for the different phases, ranked from least to most complex and costly. • It is expected that as complexity and cost increase, the refined models becomes more accurate. • At the low end of the figure, one may use back-of-the-envelope calculations as a simple, easy-to-use technique, with a relatively low level of accuracy. • At the high end, detailed models of running systems are used that are accurate but, are also costly and complex.
Chapter 4- Performance Engineering Methodology 4.1 Introduction 4.2 Performance Engineering 4.3 Motivating Example 4.4 A Model-based Methodology 4.5 Workload Model 4.5.1 Types of Workload Models 4.5.2 Clustering Analysis 4.6 Performance Models 4.7 Specifying Performance Objectives 4.7.1 Specifying a Service Level Agreement 4.7.2 Specifying Response Time 4.7.3 Specifying Cost 4.8 Concluding Remarks 4.9 Exercises Bibliography
Motivating Example(1) • Facing sharp competition, consider an automotive parts distribution company that has decided to develop and implement a new call center. • The goals of the new call center system are to: • 1) foster better relationships with customers, creating customer loyalty and ensuring quality service, • 2) improve efficiency and service performance, and • 3) identify and explore new sales opportunities.
Motivating Example(2) • The information technology team has decided to create an integrated customer relationship management system. • The proposed new architecture consists of computer telephony integration software that controls inbound calls and routes these calls to service representatives integrated with the application software. • Figure 4.2 depicts an overview of the call center architecture.
Motivating Example(3) • The call center will be staffed by service representatives who handle customer orders, • returns, • queries by phone, • fax, • and e-mail. • Basically, customers inquire about: • 1) the status of an order, • 2) the location of a shipment, and • 3) problem resolution status.
Motivating Example(4) • Each customer service representative will have immediate access to the following basic functions: • 1) historical tracking of all customer contacts, • 2) a single view of customer information, • 3) records of resolution of past problems, and • 4) help functions. • Management realizes that customers are less tolerant of long calls. • Thus, the system should meet sub-second response times on all functions and be operational 24 hours a day, 7 days a week.
Motivating Example(5) • The company wants to consider various scenarios when designing its call center. • The IT team is planning to • design, • build, • test, • and deploy the new call center applications in 12 months. • Before rollout, management wants assurances that the performance requirements are satisfied. • Questions that project management asks include: • Is the system design able to meet the subsecond response time for all functions? • What will be the impact of doubling the number of system representatives in the next year?
Motivating Example(5) • Can acceptable performance levels be maintained after integrating the system with the mainframe-based inventory application? • Is the system capacity adequate to handle up to 1,000 calls in the busiest hour and yet preserve the subsecond response time goal? • How do failures in the database server affect the 24x7 availability goal? • What is the impact of starting to offer Web-based self-service to customers?
Example 4.1(1) • Figure 4.2 shows illustrates the physical architecture of the call center system. • During the requirement analysis stage, the analysts specify the type of system architecture and the resources that will support the QoS goals for the system. • The analysts want an initial idea about the models that will be used in the performance engineering analysis phase. • Consider a first attempt for a workload model. • Initially, one needs to define the workload to be characterized.
Example 4.1(2) • There are multiple and different workloads in a system depending on the point of view from which one looks at the workload. • The workload presented to the call center system consists of the rate of telephone calls into the call center. • From the IT application standpoint, the workload consists of all functions it receives from the representatives during an observation period. • A database server may receive queries from the application server, which in turn receives function execution requests from the representatives.
Example 4.1(3) • The load of the local network is usually described in terms of its traffic characteristics, including the • packet size distribution • and the interpacket arrival time. • A second issue that must be about the workload model is the level of detail its description. • A high-level description specifies the workload from the user's point of view. • For instance, one could specify the load in terms of functions submitted by the users. • On the other hand, a low-level characterization describing the user's requests in resource-oriented terms
Example 4.1(4) • (e.g., average CPU time per function and number of I/O operations per function) is not available until the later stages of the system lifecycle. • At this stage of the project, the analysts have an overall view of the system's two-tier architecture, composed of an application server and a database server. • Initially, the performance model is a simple black box. • The desired output of the model includes • throughput, • response time, • and availability.
Example 4.2(1) • Consider the call center system described in the motivating example. • During the system design stage, the analyst needs to answer the following question: • what should be the system throughput to meet the subsecond response time requirement? • At this stage, the analyst makes assumptions such as: • 1) the number of service representatives will be 200, and • 2) during the busiest hour, 80% of the representatives are working simultaneously answering calls.
Example 4.2(2) • The conversation of a representative with a customer can be represented by a simple interaction model. • The representative listens to the customer, selects a function, submits it to the system, waits for the system to respond, watches while the results appear, talks to the • customer, • terminates the call, • and waits for another customer call. • The think time corresponds to the period of time between a reply to a function execution request and the following submission.
Example 4.2(3) • At this stage of the project, the analyst's view of the call center application is a black box, modeled by Fig. 4.3 • The analyst estimates an average think time of 30 sec, denoted by Z. • The number of active representatives in the system, denoted by N, is equal to 200 x 0.80. • The system throughput is denoted by X0. • If the response time, R, is not to exceed 1 second, it follows from the Interactive Response Time Law (see Chapter 3) that • Then,
Example 4.3(1) • During the system development phase, the various components of the system are implemented. • Suppose that during this phase, the analysts determine that each function submitted by a representative demands 2.2 queries from the database server. • Before developing the database component of the system, they need to know the required capacity of the database server that is needed to meet the performance objectives. • The Forced Flow Law, discussed in Chapter 3, applied to the database server establishes a relationship between the database server throughput and the system throughput.
Example 4.3(2) (4.3.1) • That is, • where XDB is the database server throughput, X0 denotes the total system throughput, • and VDB is the average number of visits per function to the database server. • The minimum database server throughput, in queries/sec, is obtained in Example 4.2 as X0 5.16 functions/sec. • Considering that the minimum system throughput is 5.16 functions/sec and each function accesses the database server 2.2 times, • the minimum database server throughput, measured in queries per second is
Example 4.4(1) • Measuring the performance of the call center applications is a key issue in the process of guaranteeing the quality of service objectives. • It is also an essential step for performance engineering, because it collects data for performance analysis and modeling. • These measurement data are used to calculate the model input parameters, which describe the system configuration, the software environment, and the workload of the call center system. • Let the average response time be denoted by Rcall.
Example 4.4(2) • The response time can be decomposed into three main components: • where represent the • response time at the application server, • the Local Area Network, • and the database server, • respectively.
Example 4.4(3) • The description of the motivating example provides a performance requirement that Rcall < 1. • In the operation stage, the system is constantly monitored to verify that performance objectives are being met. • During the peak hour, the system shows signs of saturation, with average response times longer than one second. • Management is considering upgrading the database server and wants to know what component of the server is most responsible for slowing down its response time.
Example 4.4(4) • The relevant questions include: • What is the average response time per query? • What is the average throughput of the DB server? • What are the utilizations of the CPU and disks? • For the sake of simplicity, consider that the database server services only one type of transaction: • query. The DB server has one CPU and two disks. • During the peak period, the DB server receives requests from the application server at a rate of 57,600 queries per hour.
Example 4.4(5) • Based on measurements collected during the operation of the call center application, the analyst obtains the following data: • on average, each query needs 50 msec of CPU and performs four I/Os on disk 1 and two I/Os on disk 2. • Each I/O takes an average of 8 msec. • The throughput, X0, is equal to the average arrival rate l,given by: • 57,600/3,600 = 16 queries/sec. • The service demand at the CPU, DCPU, is 0.050 sec. • The service demands at disks 1 and 2 are:
Example 4.4(6) • From the Service Demand Law (see Chapter 3), • Therefore, the utilization of the CPU and the disks are given by • respectively.
Example 4.4(7) • Using the residence time equation for open queuing networks of Chapter 13, the residence times at the CPU and disks are: • The total response time is the sum of all residence times.
Example 4.4(8) • Thus, The CPU is the bottleneck since it has the largest service demand. • As the load increases, the CPU utilization will reach 100% before any other device and will limit the throughput of the database server.
Example 4.5.(1) • Now consider the evolution stage of the call center system. • The company is considering to develop Web applications to allow customers access to the information they need without assistance from a customer representative. • Web self-services reduce transaction costs and enhance the customer experience. • To let users directly access the call center database, management wants to make sure that security requirements will be met. • Security depends on the context in which security issues are raised [4].
Example 4.5.(2) • In the business context, the security emphasis is on the protection of assets. • Management wants to minimize the risk of unauthorized modification of the information in the call center database. • Thus, software engineers involved need to design a new type of transaction that satisfies the security requirements. • The security requirement has implications on two areas of the system [4]: • interface and internal architecture.
Example 4.5.(3) • The new interface should include authentication services that perform the mapping between the user's identity and the person using the system. • New auditing features should be included to aid administrators discover the history of unauthorized access in the event of a security breach. • In terms of the internal architecture, the designers plan to modify the access control mechanisms to the database information. • Before embarking on the developing and implementation of the Web application, management wants to assess the likely impact of the new application on the call center service.
Example 4.5.(4) • From the software model [25], the analyst is able to estimate the service demands for the new class of transactions, submitted via the Web. • A new performance model for the database server is developed. • The database server model is subject to two types of transactions: local queries and Web queries. • The arrival rate of local queries transactions is 16 tps • and the arrival rate of Web queries transactions is 1 tps. • The service demands for the • CPU, • disks 1, • and disk 2, are given in Table 4.1.
Example 4.5.(5) • Using the equations for the multiple-class case of open queuing networks (see Chapter 13) and the OpenQN.XLS MS Excel workbook the model can be solved and the results show management the impact of Web transactions on call center applications. • The response times for local queries and Web queries at the database server are 1.14 sec and 3.85 sec, respectively. • These numbers provide management with a concrete sense of the impact of implementing Web applications on the current infrastructure of the call center system.
Table 4.1. Service Demands and Arrival Rates of Database Transactions for Ex. 4.5
Chapter 4- Performance Engineering Methodology 4.1 Introduction 4.2 Performance Engineering 4.3 Motivating Example 4.4 A Model-based Methodology 4.5 Workload Model 4.5.1 Types of Workload Models 4.5.2 Clustering Analysis 4.6 Performance Models 4.7 Specifying Performance Objectives 4.7.1 Specifying a Service Level Agreement 4.7.2 Specifying Response Time 4.7.3 Specifying Cost 4.8 Concluding Remarks 4.9 Exercises Bibliography
A Model-based Methodology(1) • This section describes the basic steps used to design and analyze computer systems with performance in mind. • The methodology builds on workload and performance models and can be used throughout the phases of the system lifecycle. • Performance engineering provides a series of steps to be followed in a systematic way [2]. • Figure 4.4 gives an overview of the main steps of the quantitative approach to analyze the performance of a system.
A Model-based Methodology(2) • The starting point of the methodology is to specify system performance objectives. • These objectives should be quantified as part of the system requirements. • Performance objectives are used to establish service level goals. • Service level goals are defined, business metrics are established, • and the performance goals of the system are documented. • Once the system and its quantitative objectives have been determined, one is able to go through the quantitative analysis cycle.
A Model-based Methodology(3) • The various steps of the quantitative analysis cycle are: • Understand the system. • The first step is to obtain an in-depth understanding of the system architecture and conduct an architecture-level review with emphasis on performance. • This means answering questions such as: • What are the system requirements of the business model? • What type of software (i.e., operating system, transaction monitor, DBMS, application software) is going to be used in the system? .
A Model-based Methodology(4) • This step yields a systematic description of the system architecture, its components, and goals. • It is an opportunity to review the performance issues of the proposed architecture. • Characterize the workload. • In this step, the basic components that compose the workload are identified. • The choice of components depends both on the nature of the system and the purpose of the characterization. • The product of this step is a statement such as "The workload under study consists of e-business transactions, e-mail messages, and data-mininig requests."
A Model-based Methodology(5) • The performance of a system with many clients, servers, and networks depends heavily on the characteristics of its load. • Thus, it is vital in any performance engineering effort to understand clearly and characterize accurately the workload [8, 13]. • The workload of a system can be defined as the set of all inputs that the system receives from its environment during any given period of time. • For instance, if the system under study is a database server, then its workload consists of all transactions (e.g., query, update) processed by the server during an observation interval.
A Model-based Methodology(6) • Measure the system and obtain workload parameters. • The third step involves measuring the performance of the system and obtaining values for the parameters of the workload model. • Measurement is a key step to all tasks in performance engineering. • It allows one to understand the parameters of the system and to establish a link between a system and its model. • Performance measurements are collected from different reference points, carefully chosen to observe and monitor the environment under study.