Download
1 / 1
10 likes | 117 Views
CHESAPEAKE BAY CODAR DATA QUALITY &VALIDATION MEASURES. Site. Mean (cm/s). Standard Deviation (cm/s). Search Radius (km). Cape Henry. 16.2. 14.0. 2. Thimble Shoals. 13.2. 11.2. 1. York Spit. 13.9. 10.0. 1.25. Introduction. ADCP Comparisons.

E N D
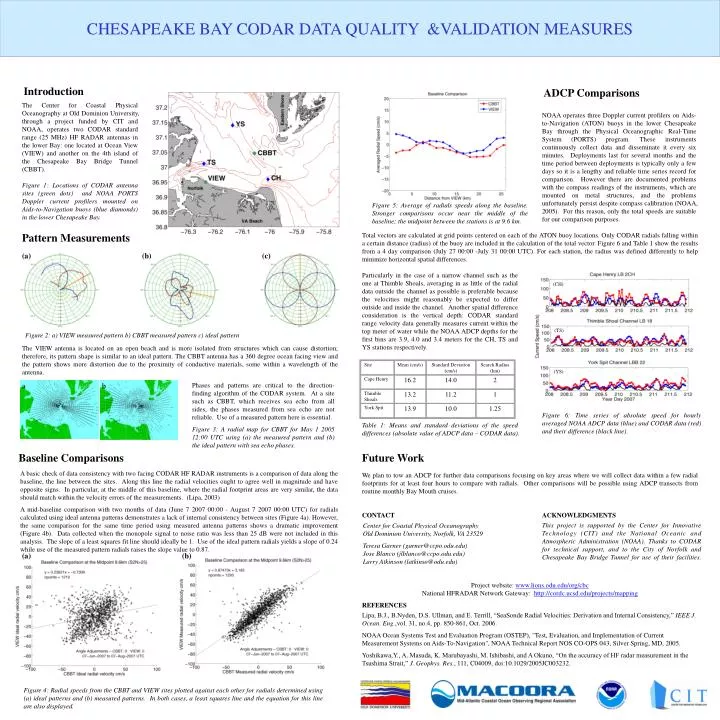
CHESAPEAKE BAY CODAR DATA QUALITY &VALIDATION MEASURES Site Mean (cm/s) Standard Deviation (cm/s) Search Radius (km) Cape Henry 16.2 14.0 2 Thimble Shoals 13.2 11.2 1 York Spit 13.9 10.0 1.25 Introduction ADCP Comparisons The Center for Coastal Physical Oceanography at Old Dominion University, through a project funded by CIT and NOAA, operates two CODAR standard range (25 MHz) HF RADAR antennas in the lower Bay: one located at Ocean View (VIEW) and another on the 4th island of the Chesapeake Bay Bridge Tunnel (CBBT). NOAA operates three Doppler current profilers on Aids- to-Navigation (ATON) buoys in the lower Chesapeake Bay through the Physical Oceanographic Real-Time System (PORTS) program. These instruments continuously collect data and disseminate it every six minutes. Deployments last for several months and the time period between deployments is typically only a few days so it is a lengthy and reliable time series record for comparison. However there are documented problems with the compass readings of the instruments, which are mounted on metal structures, and the problems unfortunately persist despite compass calibration (NOAA, 2005). For this reason, only the total speeds are suitable for our comparison purposes. Figure 1: Locations of CODAR antenna sites (green dots) and NOAA PORTS Doppler current profilers mounted on Aids-to-Navigation buoys (blue diamonds) in the lower Chesapeake Bay. Figure 5: Average of radials speeds along the baseline. Stronger comparisons occur near the middle of the baseline; the midpoint between the stations is at 9.6 km. Pattern Measurements Total vectors are calculated at grid points centered on each of the ATON buoy locations. Only CODAR radials falling within a certain distance (radius) of the buoy are included in the calculation of the total vector. Figure 6 and Table 1 show the results from a 4 day comparison (July 27 00:00 -July 31 00:00 UTC). For each station, the radius was defined differently to help minimize horizontal spatial differences. (a) (b) (c) Particularly in the case of a narrow channel such as the one at Thimble Shoals, averaging in as little of the radial data outside the channel as possible is preferable because the velocities might reasonably be expected to differ outside and inside the channel. Another spatial difference consideration is the vertical depth: CODAR standard range velocity data generally measures current within the top meter of water while the NOAA ADCP depths for the first bins are 3.9, 4.0 and 3.4 meters for the CH, TS and YS stations respectively. (CH) (TS) Figure 2: a) VIEW measured pattern b) CBBT measured pattern c) ideal pattern The VIEW antenna is located on an open beach and is more isolated from structures which can cause distortion; therefore, its pattern shape is similar to an ideal pattern. The CBBT antenna has a 360 degree ocean facing view and the pattern shows more distortion due to the proximity of conductive materials, some within a wavelength of the antenna. (YS) a b Phases and patterns are critical to the direction-finding algorithm of the CODAR system. At a site such as CBBT, which receives sea echo from all sides, the phases measured from sea echo are not reliable. Use of a measured pattern here is essential. Figure 3: A radial map for CBBT for May 1 2005 12:00 UTC using (a) the measured pattern and (b) the ideal pattern with sea echo phases. Figure 6: Time series of absolute speed for hourly averaged NOAA ADCP data (blue) and CODAR data (red) and their difference (black line). Table 1: Means and standard deviations of the speed differences (absolute value of ADCP data – CODAR data). Baseline Comparisons Future Work A basic check of data consistency with two facing CODAR HF RADAR instruments is a comparison of data along the baseline, the line between the sites. Along this line the radial velocities ought to agree well in magnitude and have opposite signs. In particular, at the middle of this baseline, where the radial footprint areas are very similar, the data should match within the velocity errors of the measurements. (Lipa, 2003) A mid-baseline comparison with two months of data (June 7 2007 00:00 - August 7 2007 00:00 UTC) for radials calculated using ideal antenna patterns demonstrates a lack of internal consistency between sites (Figure 4a). However, the same comparison for the same time period using measured antenna patterns shows a dramatic improvement (Figure 4b). Data collected when the monopole signal to noise ratio was less than 25 dB were not included in this analysis. The slope of a least squares fit line should ideally be 1. Use of the ideal pattern radials yields a slope of 0.24 while use of the measured pattern radials raises the slope value to 0.87. We plan to tow an ADCP for further data comparisons focusing on key areas where we will collect data within a few radial footprints for at least four hours to compare with radials. Other comparisons will be possible using ADCP transects from routine monthly Bay Mouth cruises. CONTACT ACKNOWLEDGMENTS Center for Coastal Physical Oceanography Old Dominion University, Norfolk, VA 23529 Teresa Garner (garner@ccpo.odu.edu) Jose Blanco (jlblanco@ccpo.odu.edu) Larry Atkinson (latkinso@odu.edu) This project is supported by the Center for Innovative Technology (CIT) and the National Oceanic and Atmospheric Administration (NOAA). Thanks to CODAR for technical support, and to the City of Norfolk and Chesapeake Bay Bridge Tunnel for use of their facilities. (a) (b) Project website: www.lions.odu.edu/org/cbc National HFRADAR Network Gateway: http://cordc.ucsd.edu/projects/mapping REFERENCES Lipa, B.J., B.Nyden, D.S. Ullman, and E. Terrill, “SeaSonde Radial Velocities: Derivation and Internal Consistency,” IEEE J. Ocean. Eng.,vol. 31, no.4, pp. 850-861, Oct. 2006. NOAA Ocean Systems Test and Evaluation Program (OSTEP), "Test, Evaluation, and Implementation of Current Measurement Systems on Aids-To-Navigation", NOAA Technical Report NOS CO-OPS 043, Silver Spring, MD, 2005. Yoshikawa,Y., A. Masuda, K. Marubayashi, M. Ishibashi, and A Okuno, “On the accuracy of HF radar measurement in the Tsushima Strait,” J. Geophys. Res., 111, C04009, doi:10.1029/2005JC003232. Figure 4: Radial speeds from the CBBT and VIEW sites plotted against each other for radials determined using (a) ideal patterns and (b) measured patterns. In both cases, a least squares line and the equation for this line are also displayed.