Download
1 / 163
1.63k likes | 1.82k Views
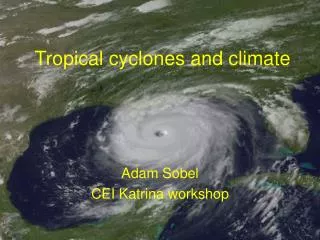
Training Session: Satellite Applications on Tropical Cyclones: Dvorak Technique. NOAA/NESDIS STAR/CORP/RAMM CIRA / Fort Collins, CO. Dvorak Technique: Background Information.

E N D
Training Session: Satellite Applications on Tropical Cyclones: Dvorak Technique NOAA/NESDIS STAR/CORP/RAMM CIRA / Fort Collins, CO
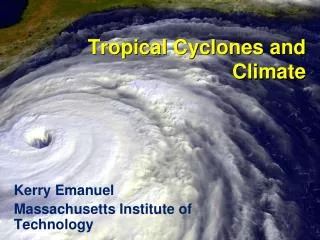
Dvorak Technique: Background Information • “The Dvorak tropical cyclone (TC) intensity estimation technique has been employed by global tropical analysis centers as the primary method for monitoring tropical systems for the last three decades. Over this time the technique has likely saved tens-of-thousands of lives in regions where over one billion people are directly affected by TCs (commonly called hurricanes, typhoons or cyclones). In fact, it is difficult to think of any other single meteorological technique that has withstood the test of time and had the life-saving impact.” • Velden et al BAMS 2006
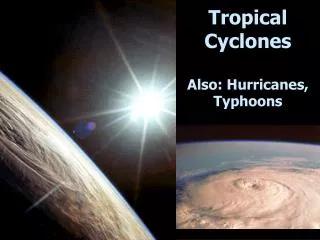
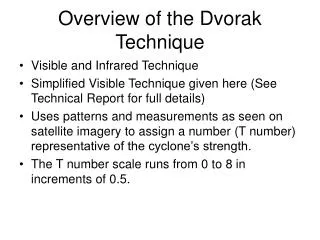
Dvorak Technique: Overview • The Dvorak Technique estimates tropical cyclone intensity by analyzing satellite image patterns and IR cloud top temperatures.
Dvorak Technique: Overview • Intensity is assigned with intensity units (called T-numbers ranging from 1 to 8, in 0.5 increments), where one T-number represents one day’s intensity change at an average rate. • The T-number can be given as a maximum surface wind speed or a minimum sea-level pressure.
Dvorak Technique: Procedure • Original Dvorak (1984) 10 Steps: • 1. Locate center • 2 and 3. Select pattern and assign DT (Data T-No.) • 4. 24-h trend • 5. Assign MET (Model expected T-No.) • 6. Assign PT (Pattern T-No.) • 7. Use DT, MET, and PT to get final T-No. • 8. Apply constraints to T-No. • 9. Adjust T-No. to CI- Number (current intensity) • 10. Forecast 24-h CI-No.
Dvorak Technique: Procedure • Simplified Approach: • 1. Locate Center • 2. Assign Pattern • 3. Make measurements (Visible or EIR) • 4. Assign T-Number • 5. Assign CI (Current Intensity)
Dvorak Technique: Procedure • The center location is used in making measurements. • 2. The pattern must be determined before measurements can be made. • 3. The measurements are meant to be as objective as possible, but still involve qualitative evaluations. • 4. The T-number and CI number are the same for intensifying or steady TC’s. With weakening TC’s the CI number may be higher than the T-number.
Center location (fixing) • Important component of the Dvorak Technique’s intensity assignment procedure • Additional uses of center locations: • Track the motion of the tropical cyclone • Numerical model initialization
Center location (fixing) Overview • Center Location = surface center • Center of circulation • Lowest sea-level pressure • Visible and IR methods – Dvorak • Eye • Distinct and inferred center with shear pattern and low-level clouds • Spiral bands and curved cloud lines • Wedge method • Using animation • Low-level cloud motions • Deep layer cloud motions • Ignore cirrus layer cloud motions • Mid-level centers tilted from surface center • Using microwave images • Thick cirrus clouds in visible and IR images obscure features below, used for center location • Thick cirrus clouds in microwave images are more transparent, and the microwave images may often provide better views of features, for improved center locations • Using 3.9-micrometer images at night
Center Location • Center Location = surface center • Center of circulation • Lowest sea-level pressure
Center Location • Methods for locating the center in single images • Eye • Spiral bands and curved cloud lines • Low-level cloud lines, with shear pattern • Wedge method
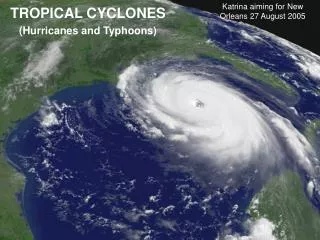
Where’s the center ? • Examples with : • Eye • Central Dense Overcast
Center Location • Increasing difficulty and uncertainty…going down the following list: • Well-defined eye • Large, ragged eye • Cloud covered, poorly defined eye • Central Dense Overcast (i.e. eye completely obscured by thick cirrus cloud)
Center Location • Partly “exposed” center due to vertical shear • Spiral bands with deep convective clouds • Curved cloud lines with small low-level clouds
Center Location • Wedge method (IR)
Center Location • Using animation: • Both: • Low-level cloud motions • Deep convective cloud motions Rotate cyclonically and spiral in toward the center Also, • Upper and mid-level cloud motions may indicate circulation centers (but they may be displaced from the surface center, by vertical wind shear) • Upper level cirrus cloud motions, flow outward turning anticyclonically moving away from the center • Close to the center, with low vertical wind shear, the upper level cirrus motions may show cyclonic outflow motion
Loop1 \LOOP1 dir Short loop to 1845
Loop 2 Same thing at RSO high res to 1845 \LOOP2 dir
Loop 3 Use all images in \LOOP1 dir to 2245Z