Download
1 / 14
140 likes | 269 Views
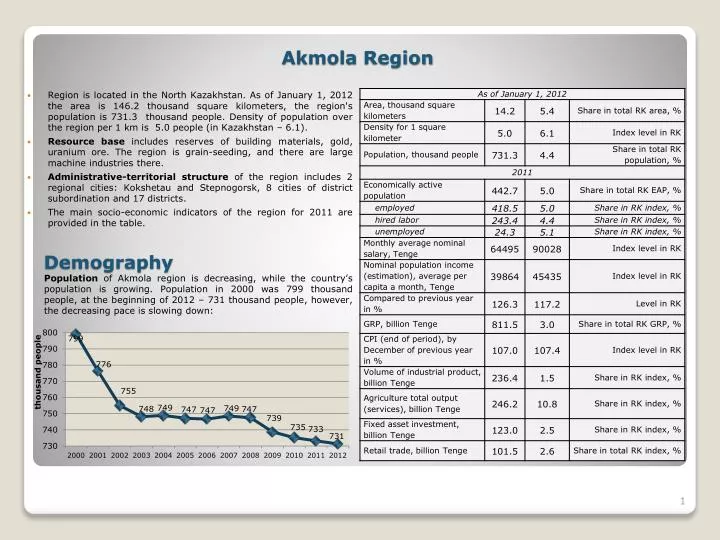
Region is located in the North Kazakhstan. As of January 1, 2012 the area is 146 . 2 thousand square kilometers, the region's population is 731 . 3 thousand people . Density of population over the region per 1 km is 5 . 0 people ( in Kazakhstan – 6 . 1).

E N D
Region is located in the North Kazakhstan.As of January 1, 2012 the area is 146.2 thousand square kilometers, the region's populationis 731.3 thousand people. Density of population over the region per 1 km is 5.0 people (in Kazakhstan – 6.1). • Resource base includes reserves of building materials, gold, uranium ore. The region isgrain-seeding, and there are large machine industries there. • Administrative-territorial structure of the region includes 2 regional cities: Kokshetau and Stepnogorsk, 8 cities ofdistrict subordination and 17 districts. • The main socio-economic indicators of the region for 2011 are provided in the table. Demography Populationof Akmola region is decreasing, while the country’s population is growing. Population in 2000 was 799 thousand people, at the beginning of 2012– 731 thousand people, however, the decreasing pace is slowing down: Akmola Region
Economically active population (EAP) • The number of employed population increases and unemployed population falls in both absolute and relative terms. For 10 years, from 2001 to 2011, the employed population has increased from 89 to 95%, while the number of unemployed has fallen from 11 to 5%. • Characteristic feature of the employed population dynamics is the growth of hired labor and the reduction of self-employed people. From 2001 to 2011 the number of hired labor increased from 53% to 58%, the number of self-employed people fell from 47 to 42%. EAP structure corresponds to the average in Kazakhstan: EAP of the region is increasing at a moderate pace and in 2011 it reached 442.7 thousand people. 418.4 thousand people are employed, 24.3 thousand people are unemployed.The economically inactive population made up132.7thousand people, that is lower the level in 2000:
The changes of employed population structure are supported by a strong tendency of unemployment rate reduction from 12.6% in 2000 to 5.5% in 2011 and an increase of economic activity of the population: • In 2011 unemployment rate of the region was slightly below the average in Kazakhstan – 5.4%: Unemployment Level
Quality of Life • Cost of living has been growing steadily since 2003, but the value is below the average in RK: • Life expectancy at birth is increasing, but dynamic values are below the average in Kazakhstan: • Some of life quality indicators in 2011: • Share of population with income used for consumption below the poverty line is decreasing,however it is below the average in Kazakhstan in 2011:
Enrollment • Enrollment share of the population aged 6-24 years has increased from 2001, but its value is below the average in RK: • The number of children in regular preschools has significantly increased since 2001: • The number of students in technical and vocational education is increasing, despite the decrease of region’s population: • The number of students in higher educationis growing steadily, despite the decrease of region’s population:
Monthly average nominal salary per employee for 2011 is 64,495 Tenge, that is below the country’s average – 90,028 Tenge: • In the dynamics the average nominal salary per employee and the average nominal income per capita are ever-growing. • The index of the nominal and real incomes showed a decline during the crisisin 2008-2009: Population Income
GRP growth in 2011 is above the average growth of total GRP of all regions of Kazakhstanand makes up 138.1% compared to 2010, against the total value of RK - 126.4%: • Despite theGRPgrowth, region’s share in total GRP of all regions has decreasedfrom 3.2% in 2000 to 2.9% in2011: Economy
Fixed assets investmenttends to a stable significant growth, however, its values decreased in 2010: • The growth of fixed assets investment in 2011 has exceeded the total average levelof all RK regions and made up 114.9% compared to previous yearagainst 107.7% in general in RK. This tendency can be explained by the base effectfrom the stronger decrease of investments in 2010 in the region compared toRK level: • The share of fixed assets investment in the Kazakhstan’s level of investment has increased from 0.55% in 2000 to 2.45% in 2011: Investment
The volume of production in agriculture increased until 2009 andhas decreased in 2010 to 108.9 billion Tenge: • The share of the region’s volume of production in agriculture in total Kazakhstan’s volume of industry’s production. In 2010 7.5% of country’s agricultural production was manufactured in the region: Agriculture
The growth of industrial production volumes was observed throughout the study period, excluding crisis years 2008-2009, when manufacturing showed a decrease: • Real sector industries with the highest values of production in 2010 areagriculture, construction, machine industry, production of food products, textile and apparel industry and etc. Agriculture, textile and apparel industries have the significant share oftotal production in the Republic of Kazakhstanand region’s GRP: • The share of industrial production in the Kazakhstan’s level has decreased significantly from 1.6% in 2000 to 1.5% in 2011: Real Sector
Sector Enterprises • The number of industrial enterprises has decreased since 2000 in both relative and absolute terms : • The number of construction companies is increasing: • The number of working agricultural enterprises is growing:
Small and Medium Business • The number of registered legal entities as of October 1, 2012 is 11221. The SME number is 11128. The structure of the enterprises number is close to the RK average level: • SME share of the region's GRP is growing at a moderate pace and exceeds the average level in RK:
Interbudgetary Relations • Budget revenues of Akmola region in 2011 amounted to119.2 trillion Tenge, including 88.3 trillion Tenge of transfers from the national budget. Expenses amounted to 118.0 trillion Tenge, including 1.9 trillion Tenge of transfers to the national budget. Thus, the region is subventional:
Main target indicators: • GRP volume index in 2015 compared to the level in 2009 shall be at least 120%. • Volume index of agricultural gross production in 2011-2015 shall be 107% in average. • Volume index of industrial output in 2015 shall be at least 170% compared to 2009 with average annual growth of 106-107%. • The export share of manufacturing output in total export in 2015 shall reach at least 43%. • The labor productivity in agriculture shall increase in 2015 by 1.5 times, up to 1926 thousand Tenge per 1 employed labor (in 2009 - 1299 thousand Tenge per 1 employed labor). • The labor productivity in manufacturing industry shall increase in 2015 by not less than 1.8 times, up to 5165 thousand Tenge (2009 - 2806 thousand Tenge per 1 employed labor). • An increase of the share of manufacturing industry in GRP at least by 14% by 2015. • The share of SMEs in the GRP shall be at least 26% by 2015. • Reduce energy intensity of GRP at least by 10% compared to 2009 level. • Coverage of children with preschool education - 72.8% in 2013 and 82.9% in 2015 (2009 - 41.9%). • Life expectancy of the population shall increase to 67.6 years in 2015. • Total mortality in 2015 shall decline at least by27%. • The unemployment rate shall not exceed 5% by 2020, 5.3% - by 2015. • Reduction of the share of population with incomes below the minimum cost of living to 6.2% in 2015. Akmola Region Development Program for 2011-2015