Download
1 / 58
630 likes | 667 Views
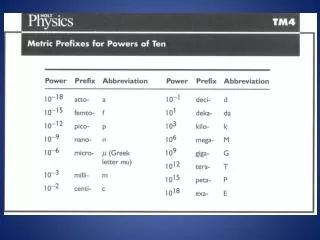
Linear Motion. Motion in one dimension. Distance (d) Scalar Measured in meters (m) Length of the path taken, (path dependent). d. Displacement (d) Vector-tail at the original position, tip at the final position. Measured in meters (m). Path independent. Distance vs. Displacement.

E N D
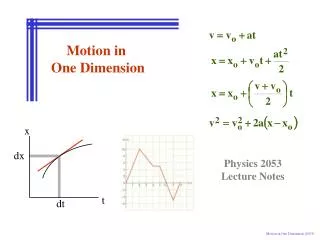
Linear Motion Motion in one dimension
Distance (d) • Scalar • Measured in meters (m) • Length of the path taken, (path dependent). d • Displacement (d) • Vector-tail at the original position, tip at the final position. • Measured in meters (m). • Path independent
Distance vs. Displacement • Follow the Hudson River 8.2 km upriver. • Cross using the George Washington Bridge bike path -- 1.8 km between anchorages. • Reverse direction and head downriver for 4.5 km. The distance traveled is 14 km The displacement is 2.7 km north.
R d2 d1 E Distance vs. Displacement Example: Starting from origin, Henry walks 90-m east, then turns around and walks 40-m west. • What is the total distance Henry walked? • What is his displacement? 130 meters 50 meters east
The length of the blue path is the distance traveled The red arrow (vector) is the displacement.
Distance vs. Displacement Determine the distance traveled and the displacement of the tractor. Starting at the barn the tractor traveled 5 km [N], 3 km [E], 5 km [S], and finally 5 km [W], returning to the barn.
Distance vs. Displacement • The distance (straight-line path) between the student and the physics lab is 8.0 m a scalar. • The displacement is x2 - x1 = 9.0 m - 1.0 m = +8.0 m - that is, 8.0 m in the +x-direction.
Velocity & Speed How is speed different from velocity?
Velocity & Speed Speed (v) • Scalar • time rate of change of distance • units m/s (m·s-1) • magnitude of velocity Velocity (v) • Vector • time rate of change of displacement • units m/s (m·s-1) • Speed with direction
Average Speed LINK
Speed • Time rate of change in distance • Scalar • No direction • The bar indicates average
Average Speed Remember average speed is just that, an average, doesn’t say anything about the instantaneous speed.
Average Speed What distance does a race car driven by Owen cover in 2 hours if its average speed for the two hours if 30 m/s?
= 10 M Average Velocity • Time rate of change in displacement • Vector quantity. • It has direction
A physics teacher walks 4 meters East, 2 meters South, 4 meters West, and finally 2 meters North. The entire motion lasted for 24 seconds. Determine the average speed and the average velocity. • Farmer Jones drives 6 miles down a straight road. He turns around and drives 4 miles back. What was his average speed for this trip if it took 1 hour?
Average Velocity • It is important to realize that the formula is for average velocity. • No matter how small a span of time you measure, it is still possible for the object to change its velocity within that time.
Instantaneous Velocity • The shorter the time period measured the closer it brings you to calculating an "instantaneous velocity". • Only if the time period becomes zero would we truly have an instantaneous velocity
Relative Velocity (Uncle Velocity?) • Velocity is not absolute, dependant on the observer. Ex: Jill sees Jack at rest and Jack sees Jill the same way. • Jill's Mother sees Jill's bus go by at 25mph. • She sees Jill traveling 25mph. • Jack on the other hand, sees Jill going zero mph. • What they observe seems to depends on their frame of reference.
Jill throws Oreo cookies to Jack at a speed of 30mph. • From their reference frame, Jack and Jill both see the cookies going 30mph. • Jill sees them going away while Jack sees them coming toward him. • Jill's mom observes the cookie tossing (eeeww!) at 55mph from where she is standing, WHY!
Jill continues to throw 30 mph cookies at Jack as the bus drives by Jack's mom on a bike. • She is riding 10 mph in the same direction as the bus is traveling 25 mph. • From her frame of reference, Jack seems to only be going 15mph (25mph - 10mph) and she sees the tossed cookies going 45mph (15mph + 30mph) • As the cookie tossing continues a car drives by going 40 mph in the other direction. • The observer in the car sees Jack going 65mph (40mph + 25mph). • The observer then notices the flying cookies to be traveling a whopping 95 mph! (40mph + 25mph +30mph)
Relative Velocity (Uncle Velocity?) Another example, when two cars are moving in the same direction with the same speed, the drivers in both cars would find that they have no relative motion at all.
Acceleration • Vector • Time rate of change of velocity • How velocity changes with time • Units m/s2 (m·s-2) • You accelerate by changing your velocity, either your speed or direction, or both.
Acceleration • Acceleration can be: • Positive, the object increases speed • Negative, the object decreases speed • Zero, the object has a constant speed and direction.
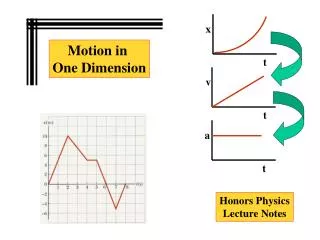
Motion graphs • Position (displacement) vs. time • Distance vs. time • Speed vs. times • Velocity vs. time • Acceleration vs. time ________
Motion graphs Distance vs. Time • If linear • Speed constant (zero acceleration) • Slope represents the speed
Motion graphs Distance vs. Time
Motion graphs Distance vs. Time • IF LINEAR • Speed constant • Slope = the speed • Speed vs. Time horizontal • Acceleration is zero • IF NON-LINEAR (parabolic) • Speed not constant • Speed changing at a constant rate • Speed vs. time linear • Slope of speed vs. time equals the acceleration • Acceleration non-zero constant
Motion graphs Distance vs. Time • The displacement-time graph of a body is as shown: • Calculate the velocity over the first 5-second period. • Calculate the velocity from 5s to 8s. • Calculate the velocity for the last two seconds. • What is the total displacement covered? • What is the average velocity over the entire 10-second stretch?
Motion graphs Distance vs. Time • A car travels at a constant velocity, covering the same distance in equal time intervals, 50 km each hour. • An d-versus-t plot is therefore a straight line. The slope of the line is equal to the velocity. • The average velocity equals the instantaneous velocity in this case. Why?
Motion graphs Distance vs. Time
Motion graphs Velocity vs. Time • If linear (horizontal) • Speed constant (zero acceleration) • Slope represents the acceleration
Motion graphs Velocity vs. Time • If linear (non horizontal) • Speed constant (zero acceleration) • Slope represents the acceleration
Motion graphs Velocity vs. Time
Motion graphs Velocity vs. Time • Slope equals the acceleration • Area under the curve equals the displacement (distance)
Motion graphs Velocity vs. Time Slope = acceleration Area under curve = distance/displacement
Motion graphs Velocity vs. Time link • The velocity-time graph of a body is as shown: • Over what time interval is the body not accelerating? • What is the acceleration between t = 0 and t = 5? • What is the total displacement covered by the body? • What is the average velocity between t = 0 and t = 8? • What is the average velocity between t = 0 and t = 10?
Motion graphs Speed vs. Time Slope = acceleration Area under curve = distance/displacement
Motion graphs Speed vs. Time Area = 30 × 20 = 600 m. distance = speed × time. distance = 30 × 20 = 600 m Slope = acceleration Area under curve = distance/displacement
Motion graphs Speed vs. Time Slope = acceleration Area under curve = distance/displacement
Motion graphs Acceleration vs. Time
Motion graphs Distance/Speed/Acceleration vs. Time
Motion graphs Distance/Speed/Acceleration vs. Time Constant Velocity Zero acceleration Increasing Velocity Constant positive acceleration
Motion graphs Distance/Speed/Acceleration vs. Time Link Increasing Positive Speed Area under speed curve equals the distance
Motion graphs Distance/Speed/Acceleration vs. Time Constant Positve Velocity
Motion graphs Distance/Speed/Acceleration vs. Time Constant Negative Velocity
Motion graphs Distance/Speed/Acceleration vs. Time Increasing Positive Velocity