Download
1 / 17
170 likes | 304 Views
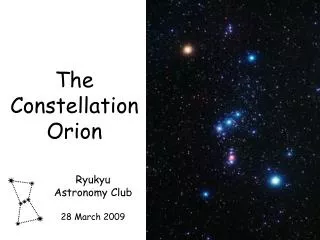
The IMF of the Orion Nebula Cluster Across the H-burning Limit. Nicola Da Rio HST Orion Treasury Science Meeting STScI, Baltimore, September 12 th 13 th 2011. Motivation. In order to derive the properties of PMS stars in Orion we need individual spectral types.

E N D
The IMF of the Orion Nebula Cluster Across the H-burning Limit Nicola Da Rio HST Orion Treasury Science Meeting STScI, Baltimore, September 12th 13th 2011
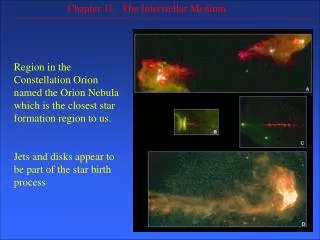
Motivation • In order to derive the properties of PMS stars in Orion we need individual spectral types. • We cannot derive spectral types from broad-band photometry U B V R I z J H K • Most of the available spectral types are for stellar objects (Hillenbrand 1997, Da Rio+2009) • In the BD mass range, spectral types are available for a small sample of sources (Slesnick+2004, Riddick+ 2007 ..) accretion Teff – AV degeneracy disk excess
Observational idea • Deriving spectral types of cool stars and brown dwarfs from medium band photometry • Deep photometry with WFI@MPG/ESO • (35’x35’ FOV) in 4 bands. • Two bands (753 and 770) are anti-correlated with the spectral type for T<4000K • I-band is needed to get the extinction star by star MB 770/19 ESO#849 BB Ic/Iwp ESO#845 MB 571/25 ESO#863 MB 753/18 ESO#848
Color-color diagram synthetic isochrone
Color-color diagram M0 = 3750K cooler hotter ר synthetic isochrone
Color-color diagram Background red giants M0 = 3750K Highly reddened early types (mostly BKG contaminants) VLMS and BDs (right to left) Possibly members Low AV early type members: NOT PRESENT BECAUSE OF SATURATATION synthetic isochrone: inaccurate for very low temperatures
Photometric depth HST/ACS Z vs (I-Z) CMD Black: all the ACS sources with I and Z Green: sources included in our previous work (Da Rio+ 2009, 2010), having WFI V,I and available spectral type Red: sources for which now I have photometry in all MB753, MB770 and I-band, and are placed in the 2-color diagram shown earlier.
Derivation of Teff e and AV Reddening independent [770 index] Extinction related [AV index] RV=3.1 from the Cardelli (1989) law
Derivation of Teff e and AV • Calibration of the [770 index]-Teff relation based on available spectral types • The index correlates with temperature for Teff < 3200K • Candidate accretors are more scattered and systematically shifted. • What is the effect of accretion excess on the [770 index]-Teff ?
Effect of accretion excess on the [770 index] Displacement of the index as a function of Laccr/Lstar and Teff computed by synthetic photometry Bias in the determined Teff if the excess is neglected. The overall effect of accretion veiling is usually neglibile
Calibration of the [AV index] De-reddened sources (based on available AV from the literature and from de-reddening ISPI photometry) allow to define the AV=0 locus The AV=0 locus nicely confines the observed photometry at positive extinctions • Teff and AV is derived for 1280 sources • 544 of them previously assigned a spectral type • 527 extra sources have Teff known and > 3200 K: • 1807 sources in Orion have now a Teff estimate
The H-R diagram Distance: 414pc (Menten et al, 2007) Bolometric correction: from synthetic photometry with empirical calibration
Background contamination • The number and relative fraction of background sources increases with fainter luminosities (see Robberto+ 2010). • We detect a population of under-luminous sources well separated from the young population. • Given the spectral type >M3 these are background red giants • ONC members seen in scattered light (e.g. Guarcello+ 2010), if present, are a neglibile fraction of these sources.
The H-R diagram We detect BDs down to 0.02Msun Masses (and ages) are assigned by interpolation of tracks and isochrones We use Baraffe et al (1998) and D’Antona & Mazzitelli (1998) models
Completeness in the HRD Photometric completeness (based on artificial star tests preserving spatial distribution of the ONC Monte Carlo method to convert completeness from observed quantities to the HRD, accounting for differential extinction Completion accounting for spectral types from previous works
The IMF Kroupa Chabrier log-normal • We measure a (completeness corrected) IMF which shows a strong deficiency of substellar objects. • This trend was observed in previous studies (Hillenbrand & Carpenter 2000, Muench 2002, Slesnick 2004), but not as prominent as in this work. • A possible explanation for this difference is our better characterization of field contamination.
Conclusions • Using a time-efficient pratical innovative medium-band photometric tecnique, we nearly doubled the sample of ONC sources with available spectral types and derived individual extinctions • This sample is complete down to the H-burning limit and extends down the BD mass range • Optical excess due to mass accretion does not affects this measurement • We detect a large population of background contaminants, which dominates over the ONC members in the BD mass range. In the HRD it is possible to exclude this contamination with high accuracy. • We derive the IMF for the ONC, which shows steep decline below the H-burning limit, suggesting a deficiency of substellar objects • The paper has been sumbitted to ApJ