Download
1 / 24
350 likes | 649 Views
Two-mode networks. Kaibin He. Outline. Data structure Visualization Quantitative Analysis Qualitative Analysis. Rectangular data array. Two-mode to One-mode. Data>Affiliations

E N D
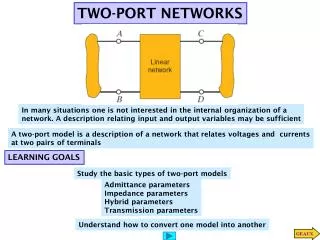
Two-mode networks Kaibin He
Outline • Data structure • Visualization • Quantitative Analysis • Qualitative Analysis
Two-mode to One-mode • Data>Affiliations • Cross-product(binary data) : multiplies each of A's scores by the corresponding score for B, and then sums across the columns
Two-mode to One-mode • Minimums (valued data): examines the entries of A and B for campaign 1, and selects the lowest score (zero). It then does this for the other campaigns and sums.
Bipartite • The matrix is formed by adding the rows as additional columns, and columns as additional rows. Transform>Bipartite
Visualization • Netdraw>File>UCINET dataset>2-Mode Network • Use scaling method to locate the points • Example: Zhou, Yuan, Wang (2013)
Quantitative analysis • Identify underlying dimensions of the joint space of actor-by-event. • Two-mode SVD analysis. (valued data)Tools>Scaling/Decomposition>SVD • Two-mode factor analysis. (valued data)Tools>Scaling/Decomposition>Factor Analysis • Two-mode correspondence analysis. (binary data)Tools>Scaling/Decomposition>Correspondence
SVD • Singular Values • RCScores • Row Scores • Column Scores • Scatter Plot • Example
Factor Analysis • Eigenvalues • Loadings • Scatter plot • Example
Correspondence analysis • Row/Column Scores • Scatter plot • Example
Qualitative analysis • Block models • Two-mode core-periphery analysis. Network>2-Mode>Categorical Core>Periphery • Two-mode factions analysis Network>2-Mode>2-Mode Factions
Two-mode core-periphery analysis • The "core" is a cluster of frequently co-occurring actors and events. • The "periphery" consists of a partition of actors who are not co-incident to the same events. • 0 means bad fit, 1 means excellent fit. • Ideal density matrix
Two-mode factions analysis • Factions are groupings that have high density within the group, and low density of ties between groups. • Example
Recommended paper The Quest for Content: How User-Generated Links Can Facilitate Online Exploration JACOB GOLDENBERG, GAL OESTREICHER-SINGER, and SHACHAR REICHMAN JMR, 2012
conclusion This dual-network structure in facilitating content exploration.